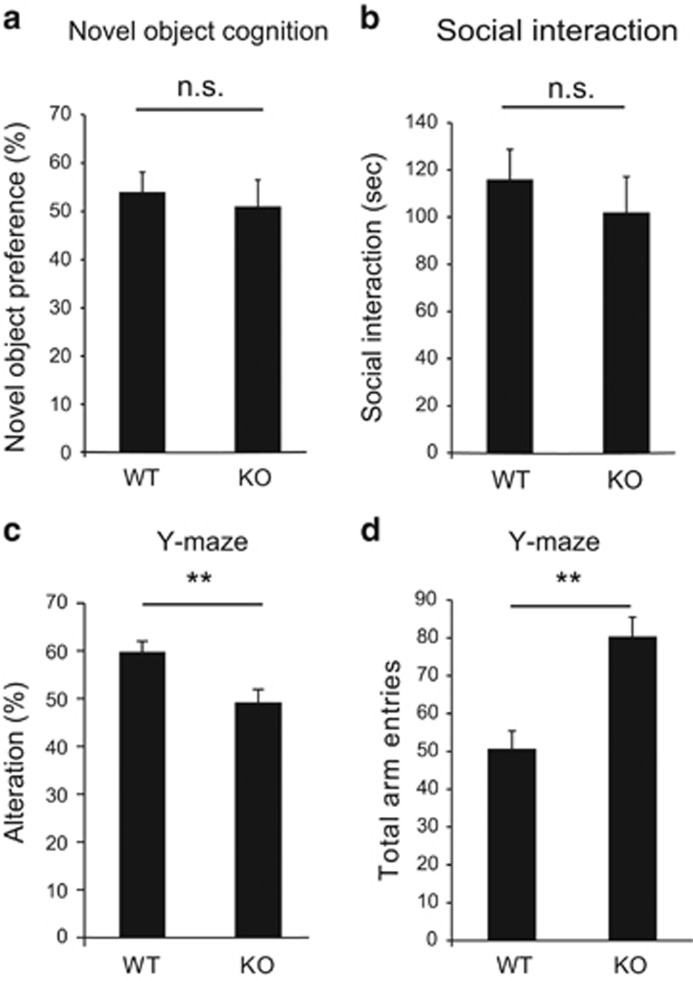
Figure 5.
JMJD2B mutant mice show deficits in short-term memory. (a) The result of the social interaction test examining the social affinity to another mouse. The graph shows the relative time of exploration of the novel object. (WT: n=13 KO: n=11). (b) Novel object recognition test to examine the interest in unknown object. (WT: n=13 KO: n=11). (c and d) Y-maze test results examining short-term memory in the two genotypes. (WT: n=10; KO: n=11). (c) The graph shows the percentage of correct entries. (d) The graph shows the number of total entries. KO, JMJD2B mutant mice; NS, not significant; WT, wild-type mice. Error bars represent s.e.m. **P<0.01.

