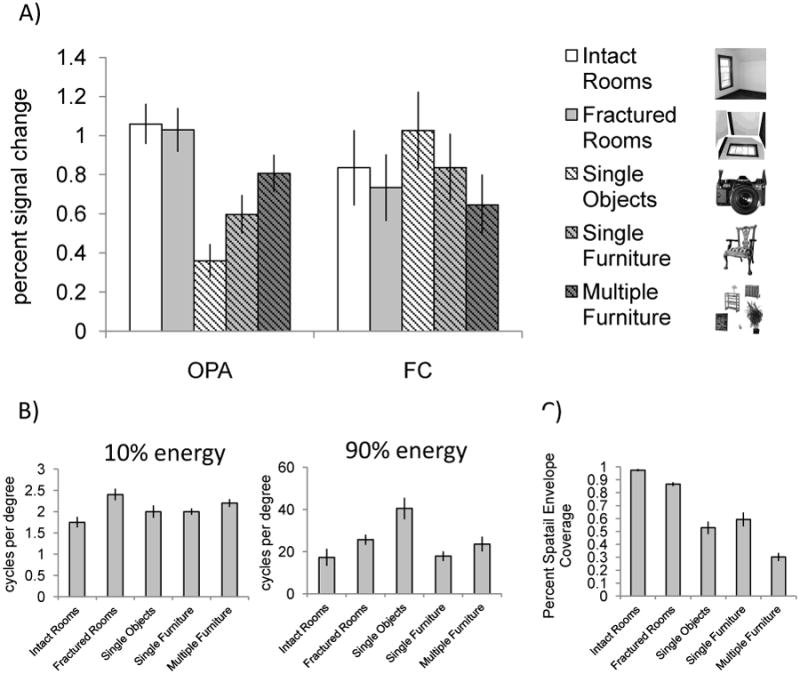
Figure 4.

(A) Average percent signal change in OPA and FC to the five conditions. Error bars indicate the standard error of the mean. A 2 (ROI: OPA, FC) × 5 (condition: intact rooms, fractured rooms, single objects, single furniture, multiple furniture) repeated measures ANOVA revealed a significant interaction (F(4,84) = 62.03, p < 0.001), indicating that the pattern of responses in OPA was not as expected for a retinotopic region. (B) Distribution of low (10% energy) and high (90% energy) spatial frequency information across the five conditions. (C) Average percent spatial envelope coverage in each condition. Importantly, while our stimuli were not precisely matched for spatial frequency content or spatial envelope coverage, none of these sources of low-level visual information predicts the pattern of responses observed in OPA.
