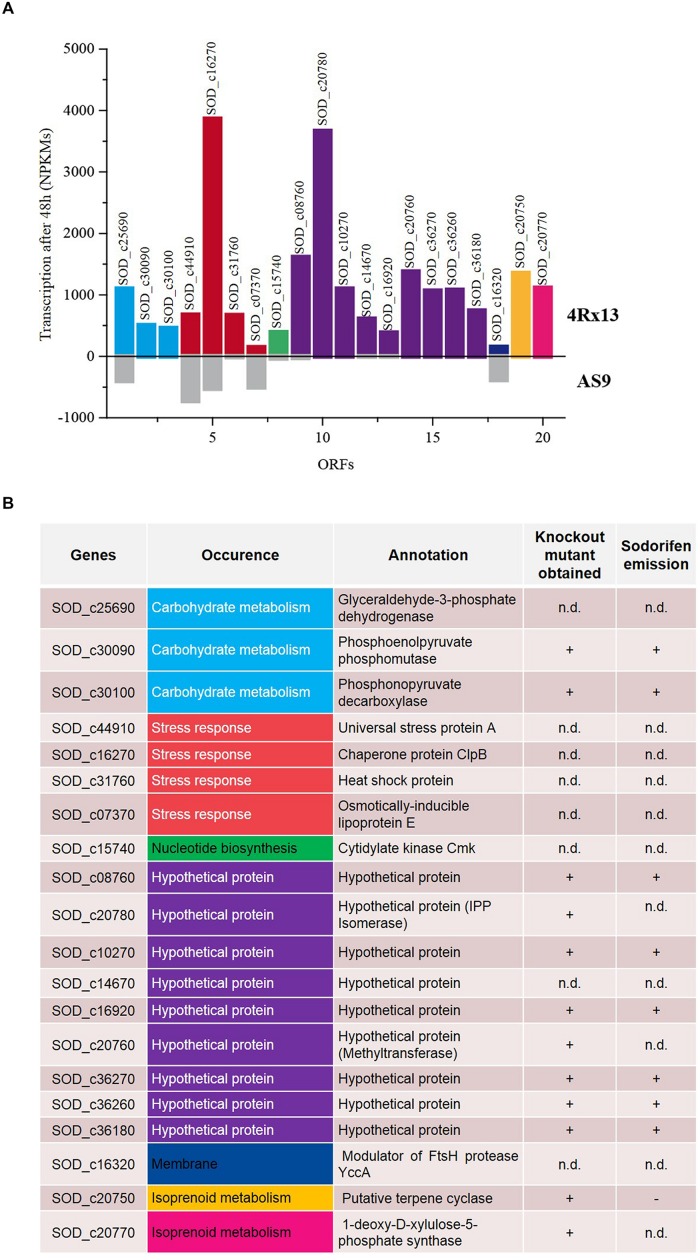
FIGURE 3.
Analysis of the transcriptomes of Serratia plymuthica 4Rx13 and AS9. Both bacterial isolates were grown over 48 h in minimal medium supplemented with succinate. Samples for RNA isolation were taken after 48 h, and mRNA was sequenced to determine the expression levels of genes. (A) Genes expressed in high levels in S. plymuthica 4Rx13 (colored bars, upper panel) and expressed at low levels or not at all in S. plymuthica AS9 (gray bars, lower panel). Transcription activity refers to nucleotide activities per kilobase of exon model per million mapped reads (NPKM). (B) Differentially expressed genes in S. plymuthica 4Rx13 and AS9 with their annotations are listed and corresponding metabolic pathways are indicated. Summarized are the knockout mutants performed so far and their respective sodorifen emission is indicated. n.d. not determined.

