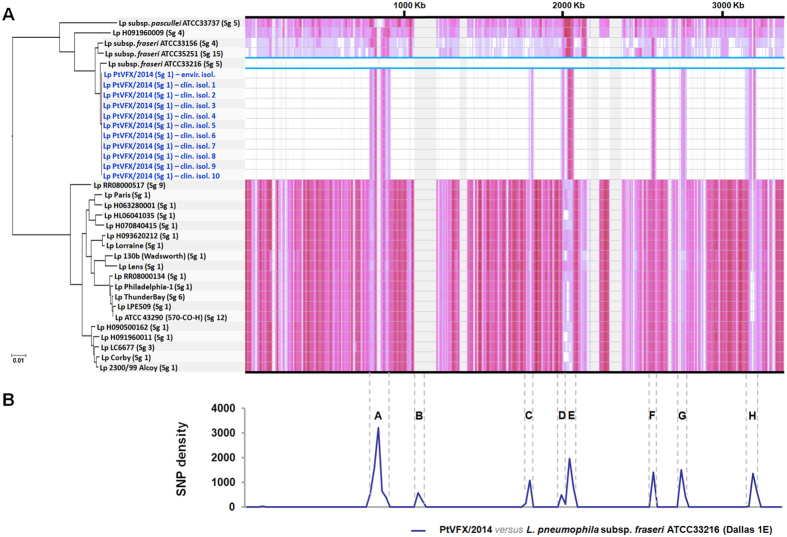
Figure 2. Phylogenomic analysis of PtVFX/2014 strain within the L. pneumophila species.
(A) A phylogenetic reconstruction enrolling genome sequences from 24 L. pneumophila strains and from 11 outbreak-associated PtVFX/2014 clones (ten clinical isolates plus one environmental isolate; in dark blue) is shown paired with the corresponding SNP density plot across the length of the genome. Serogroup (Sg) classification is also shown (see Supplementary Table S1 for details). The tree is drawn to scale, with branch lengths reflecting number of base substitutions per site. SNP density in the core-genome (~64% of the genome) is depicted proportionally to the color intensity and reflects SNPs against the genome of the L. pneumophila subsp. fraseri ATCC33216 strain (surrounded with a light blue box). Areas in grey refer to regions in the accessory genome. Genome orientation is according to that of the L. pneumophila Philadelphia-1 strain (GenBank accession number AE017354). (B) Detailed pairwise SNP density plot between PtVFX/2014 and the most close related L. pneumophila subsp. fraseri ATCC33216 strain showing putative HGT-inherited regions (labeled from A to H; see details in Table 1). Calculations of SNP density were performed across the genome alignment over a sliding window (window size = 25000 bp; step size = 25000 bp). Vertical dashed lines delimiting each region make the correspondence with the SNP density plot of panel (A).

