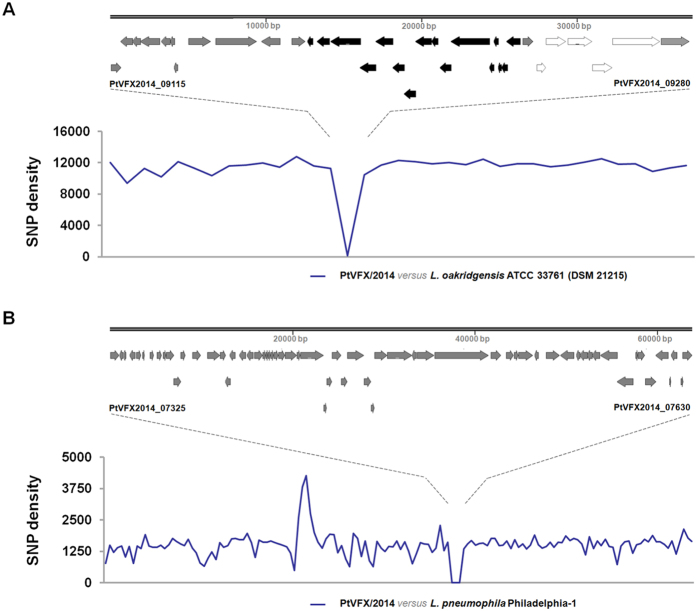
Figure 4. Relevant putative pathogenicity islands inherited by PtVFX/2014.
(A) The graph shows the SNP density across a core-genome alignment (encompassing about 39–49% of each whole-genome sequence) between PtVFX/2014 and the L. oakridgensis ATCC 33761 (or DSM 21215) strain over a sliding window (window size = 38000 bp; step size = 38000 bp). Both gene content and organization of the ~37.5 kb genomic island is highlighted above the graph, where the lvh/lvr cluster is shown in black arrows, while the gene cluster homolog to a type I-like restriction-modification system is displayed in white arrows. (B) The graph shows the SNP density across a core-genome alignment (encompassing about 86–88% of each whole-genome sequence) between PtVFX/2014 and the L. pneumophila Philadelphia-1 strain over a slinding window (window size = 20000 bp; step size = 20000 bp). Gene organization of the ~65 kb genomic island is highlighted above the graph. For both graphs, core-genome alignments were extracted (using MAUVE software) by keeping and concatenating regions where genomes aligned over at least 500 bp, x-axis do not reflect any genome orientation. Genes delimiting each genomic island are labeled in each panel.

