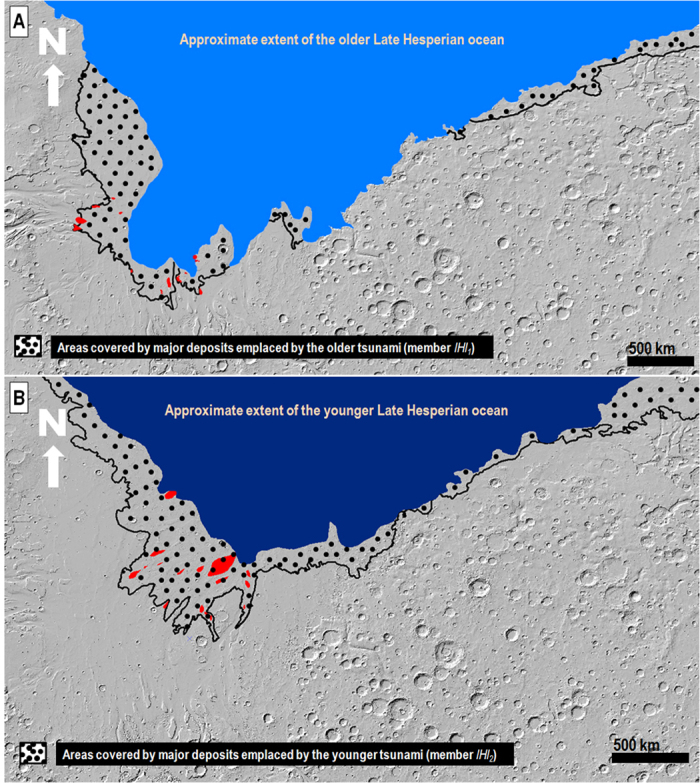
Figure 4.

(A) Late Hesperian ocean with a paleoshoreline elevation close to −3795 m (light blue), and estimated extent of the older tsunami (dotted surface). (B) Late Hesperian ocean with a paleoshoreline elevation close to −4100 m (dark blue), and estimated extent of the younger tsunami (dotted surface). The ocean margins were reconstructed by tracing the estimated paleoshoreline elevations, while carefully interpolating across topography generated by clearly younger resurfacing processes. The tsunami margins were produced using the lHl unit’s lobes extending from the projected paleoshoreline elevations. Areas marked in red represent the locations of streamlined promontories in Chryse Planitia, which were embayed, and/or buried, by materials emplaced during each of the tsunami events. Topography in (A,B) from shaded-relief MOLA digital elevation model (460 m/pixel). Credit: MOLA Science Team, MSS, JPL, NASA. We produced the mosaics and maps in this figure using Esri’s ArcGIS® 10.3 software (http://www.esri.com/software/arcgis).
