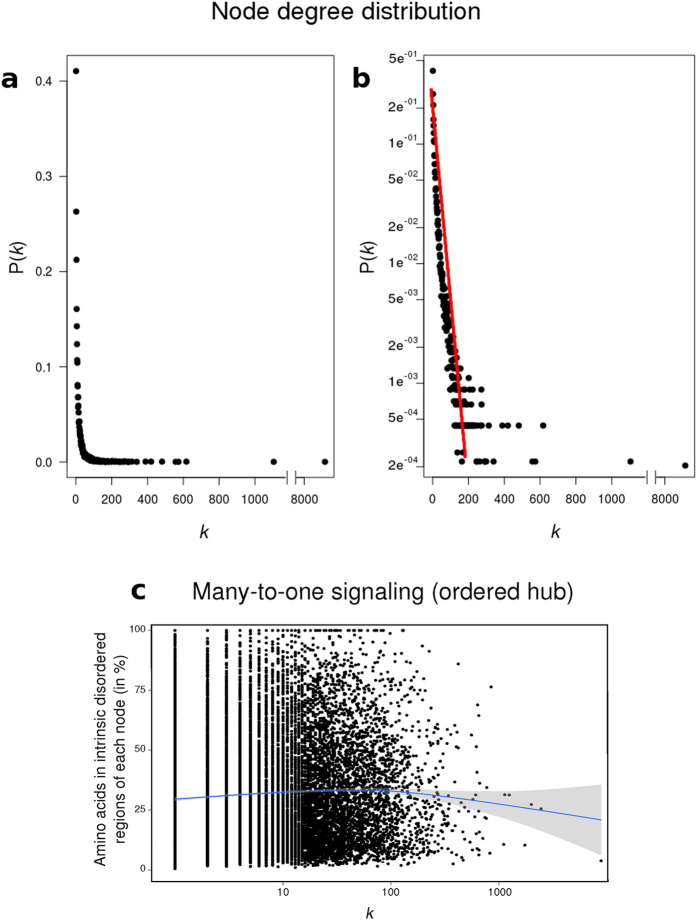
Figure 1.
Degree distribution of the network plotted both on a linear (a) and logarithmic (b) scale. The network follows the power law P(k) = Ak−3, which appears as a straight line on a logarithmic plot. Note that every degree between low-degree nodes and hubs appear with a frequency given by P(k). (c) Percentage of amino acids of each node belonging to disordered regions in relation to the node degree. The percentage of disorder of each node was calculated by the software Cspritz33. The non-parametric regression was represented by a blue line.

