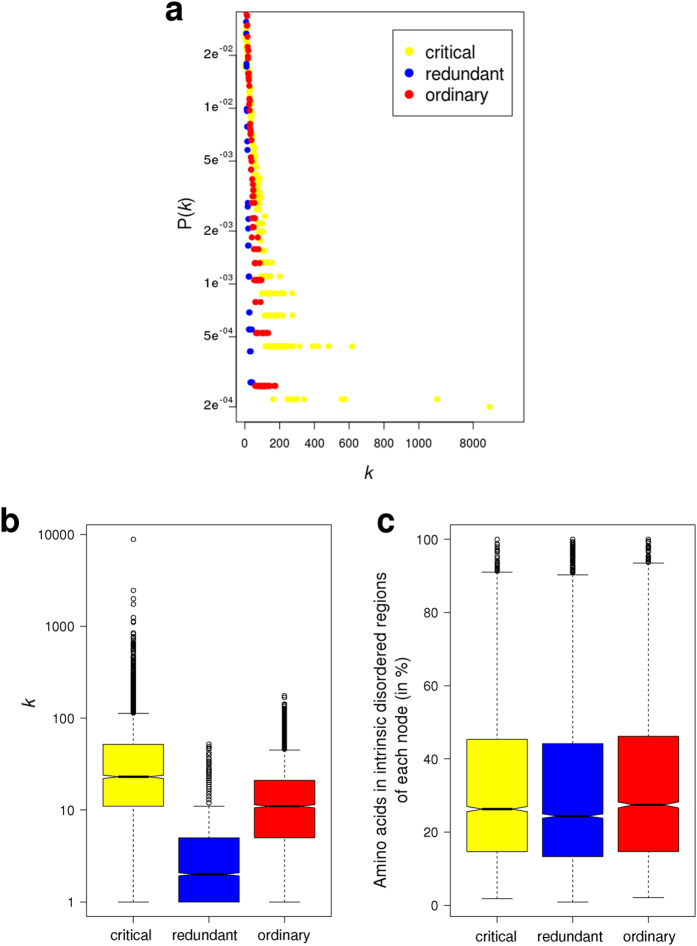
Figure 2.
(a) Degree distribution of the three node types (critical, redundant and ordinary) plotted on a logarithmic scale. As critical nodes are enriched in high-k nodes (hubs), a deviation of the straight line is observed. (b) Boxplots of node degree (k) for all proteins in the network classified in base on their participation in the network control (critical, redundant or ordinary). (c) Boxplots of the content of intrinsic disorder of each protein in the network. The percentage of disordered regions was calculated by the software Cspritz33.

