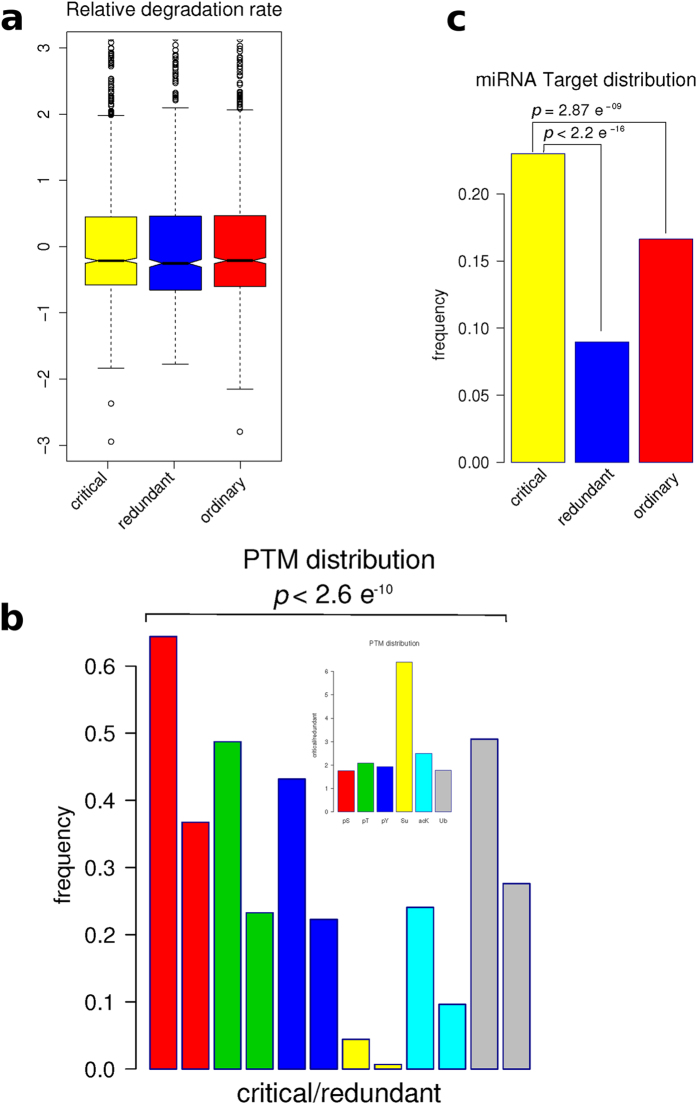
Figure 3. Characterizations of nodes by their kind of regulation.
(a) Boxplots of the distributions of relative degradation rates for critical, redundant and ordinary nodes. Note that short half-life means high relative degradation rate. (b) The bars represent the fractions of PTM regulated sites present in critical/redundant nodes. The inset shows the frequency of each PTM in the critical nodes relative to the same frequency of the PTM in the redundant nodes. (c) Nodes of each group as microRNA targets.

