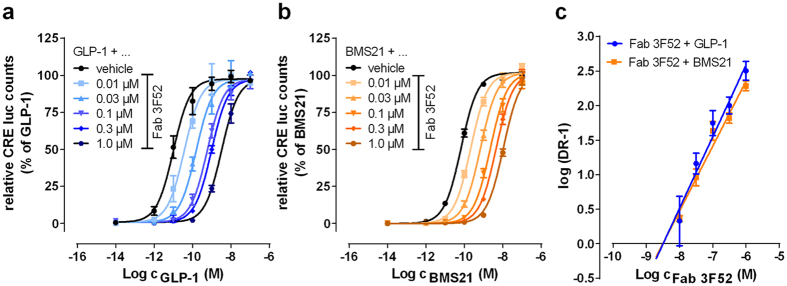
Figure 6. Fab 3F52 reveals competitive interactions with native GLP-1 and BMS21.
Concentration-response curves for native GLP-1 (a) and the short GLP-1 analogue BMS21 (b) in the absence and presence of increasing Fab 3F52 concentrations, obtained by stimulation of BHK cells stably over-expressing human GLP-1R and cAMP response element (CRE) coupled to firefly luciferase (CRE luc). Data are normalized to maximum response of GLP-1 (a) and BMS21 (b), respectively, in the absence of Fab 3F52. (c) Schild regression analyses of concentration-response curves depicted in (a,b). Dose ratio (DR) is the ratio of the apparent EC50 in the presence of a given Fab 3F52 concentration over the EC50 in the absence of Fab 3F52. The Schild plot intersects the abscissa at pA2. (a–c) Values shown represent mean ± SEM of at least 3 independent experiments.

