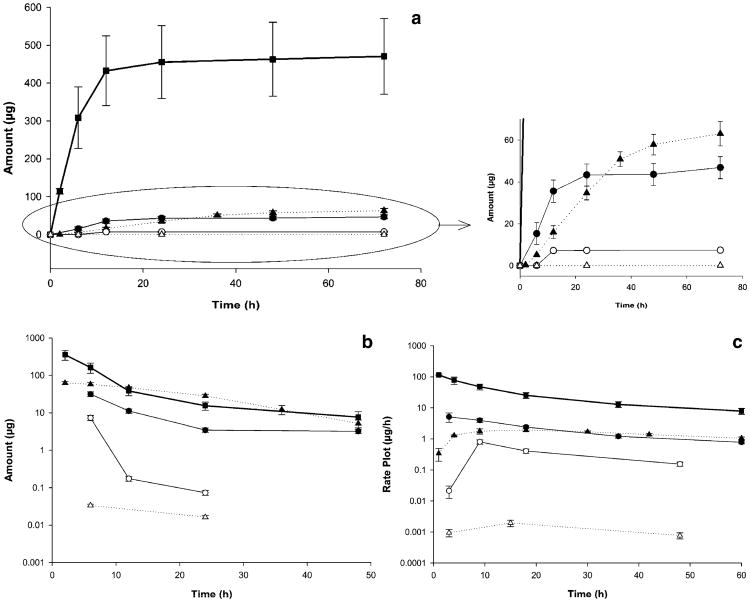
Fig. 5.
a Total amount excreted in urine plot, b amount remaining to be excreted in urine (ARE) plot, and c urinary rate plot of paclitaxel after iv administration of control Taxol® (paclitaxel in Cremophor EL:Ethanol; filled squares); paclitaxel (filled circles) and PAX7′C6 (open circles) after iv administration of control PAX7′C6 in Cremophor EL:Ethanol; and paclitaxel (filled triangles) and PAX7′C6 (open triangles) after iv administration of PAX7′C6 in PEG-b-PCL. The intravenous dose for all the formulations was 10 mg/kg to rats (mean ± SEM, n = 10 per group).

