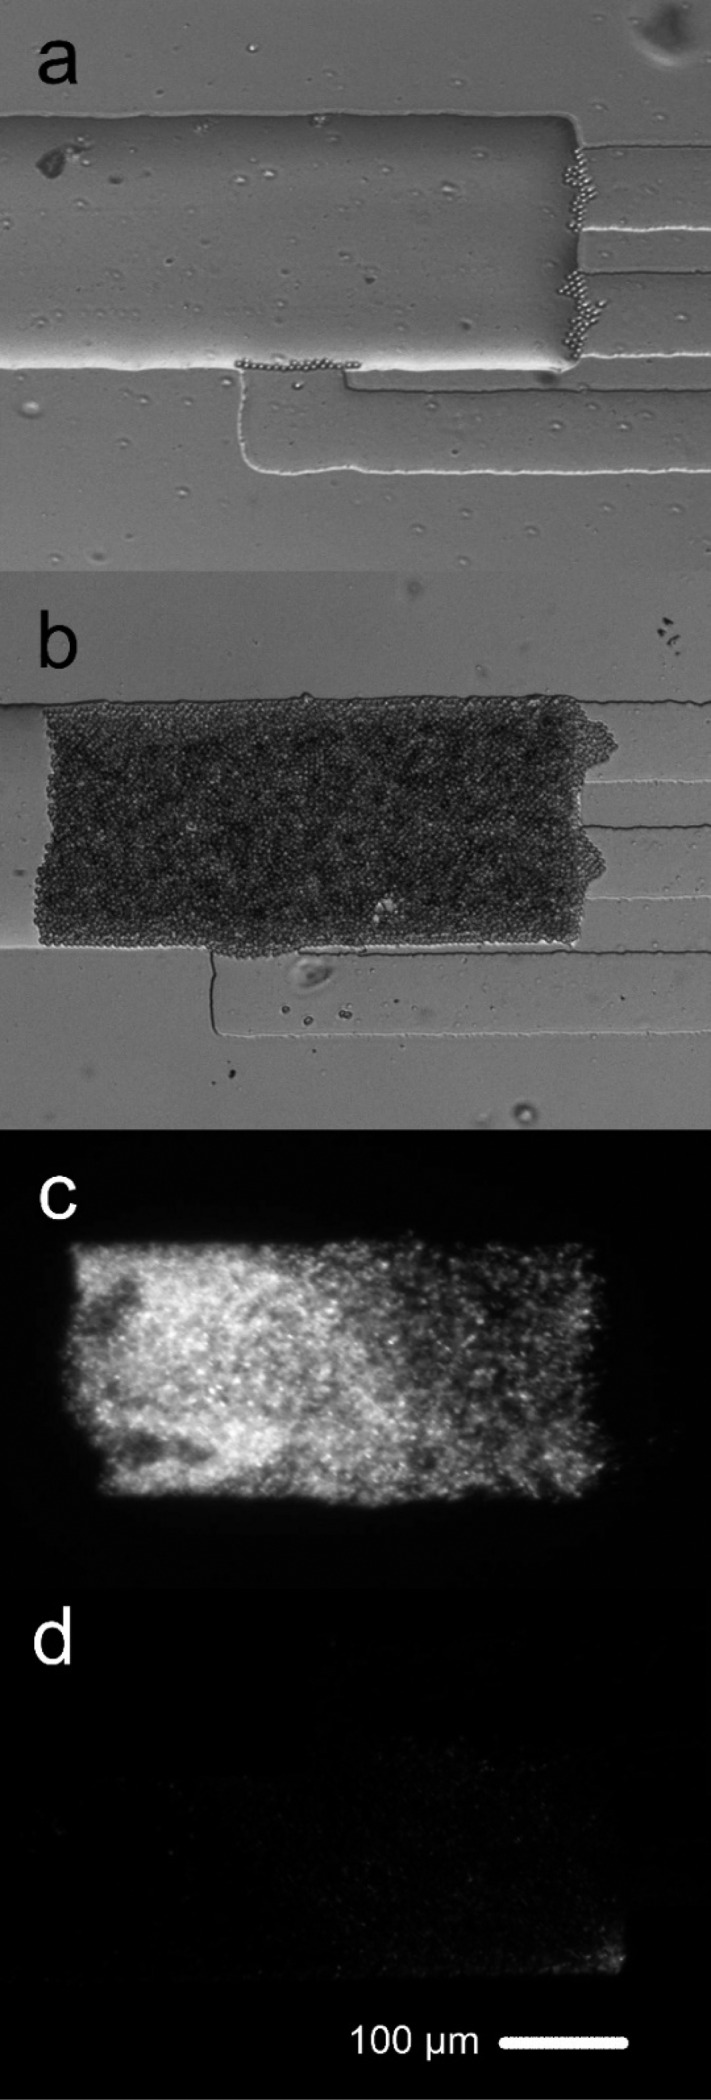
Figure 2.

Procedure for microfluidic electrolysis of M. smegmatis. (a) Bright field image shows that beads were stopped by the shallow channel and started to accumulate in the electrolysis channel. (b) Bright field image shows the formation of packed bed of beads/M. smegmatis cells. (c) Fluorescence image shows the GFP expressing M. smegmatis cells before electrolysis. The packed bed roughly contained 2 × 10⁵ cells. (d) Fluorescence image after electrolysis (30 pulses of 6000 V/cm and 5 s each).
