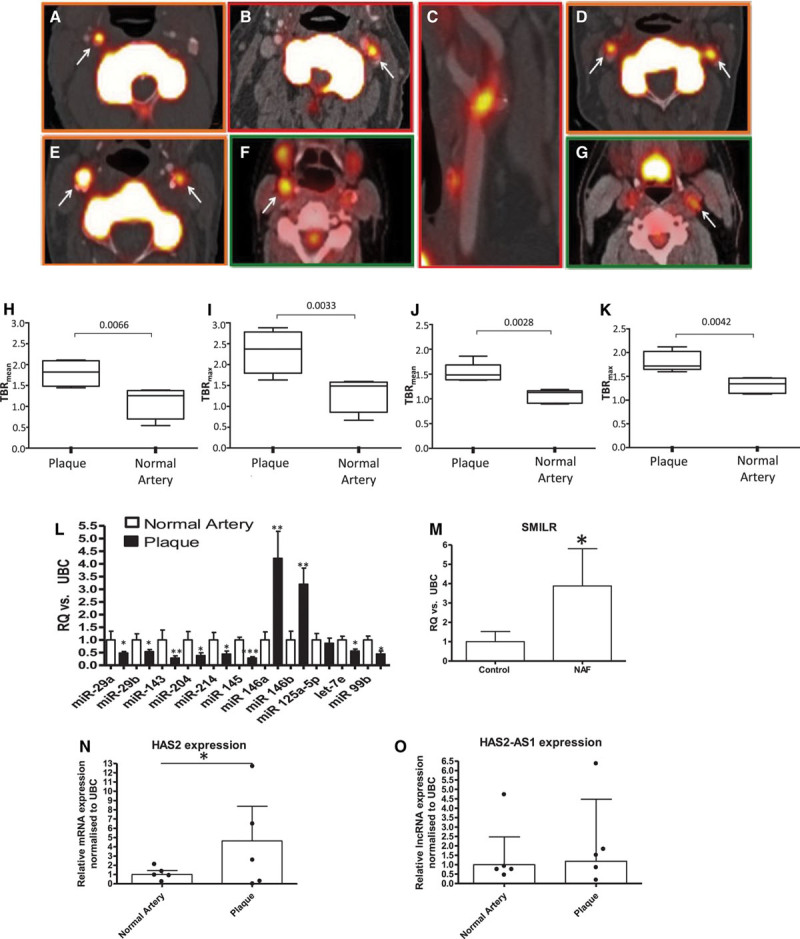
Figure 7.

Uptake of [18F]fluoride and [18F]FDG within plaque and normal artery and changes in noncoding RNA expression within carotid plaques. Axial images demonstrating unilateral (A, B) or bilateral [18F]fluoride carotid uptake (D, E). C is a multiplanar reformat of B. Axial images demonstrating [18F]FDG carotid uptake (F, G). H shows the Siemens Biograph Clinical PET/CT system used for imaging. White arrows indicate carotid radioligand uptake. H through K, L, Uptake of tracer: MicroRNA profile of atherosclerotic plaque and paired healthy carotid controls (n=6) assessed by qRT-PCR (paired Student t test). Expression of SMILR (M), HAS2 (N), and HAS2-AS1(O) within atherosclerotic plaque (n=5). Analyzed via qRT-PCR analysis, ***P<0.001, **P<0.01, and *P<0.05 assessed by paired Student t test. CT, computed tomography; [18F]FDG, 18F-fluorodeoxyglucose; PET, positron emission tomography; and qRT-PCR, quantitative real-time polymerase chain reaction.
