
FIGURE 2.
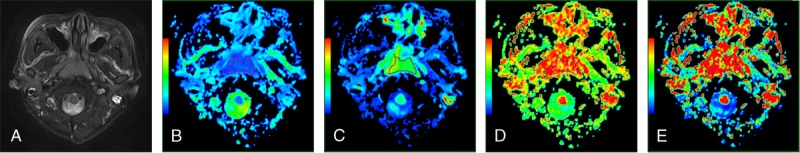
Representative images of a lymphoma. Images 2A to 2E are axial T2-weighted images, ADC, D, D*, and f maps, respectively. The ADC, D, D* and f values of the lesion were 0.734 × 10⁻³, 0.545 × 10⁻³, and 5.925 × 10⁻³mm2/s, and 0.149, respectively.