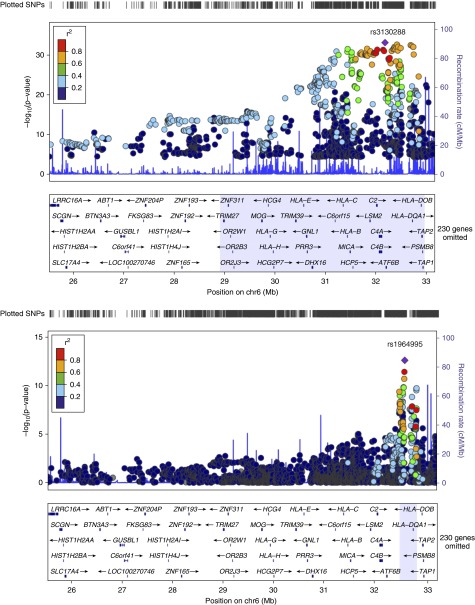
Figure 2.
Regional association plots of chr6:25527073–33191175. Löfgren’s syndrome (LS)-associated single-nucleotide polymorphisms (SNPs) (top) at PGC < 5 × 10⁻⁸ highlight region chr6:28910128–3295881. Non-LS–associated SNPs (bottom) at PGC < 5 × 10⁻⁸ highlight region chr6: 32447326–32789970. PGC = genomic-controlled P value.

