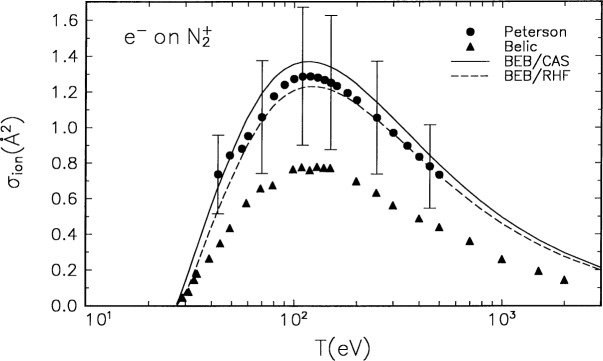
Fig. 2.
Comparison of the BEB cross section to experiments for . Solid curve, BEB cross section using the constants from the restricted open-shell Hartree-Fock wave function; dashed curve, BEB cross section using the constants from the complete-active-space SCF wave functions; circles, experimental data by Peterson et al. [10]; and triangles, data by Belic et al. [12] and Siari et al. [11]. The two sets of experimental data represent slightly different physical quantities (see text). See Fig. 1 caption for other legend.

