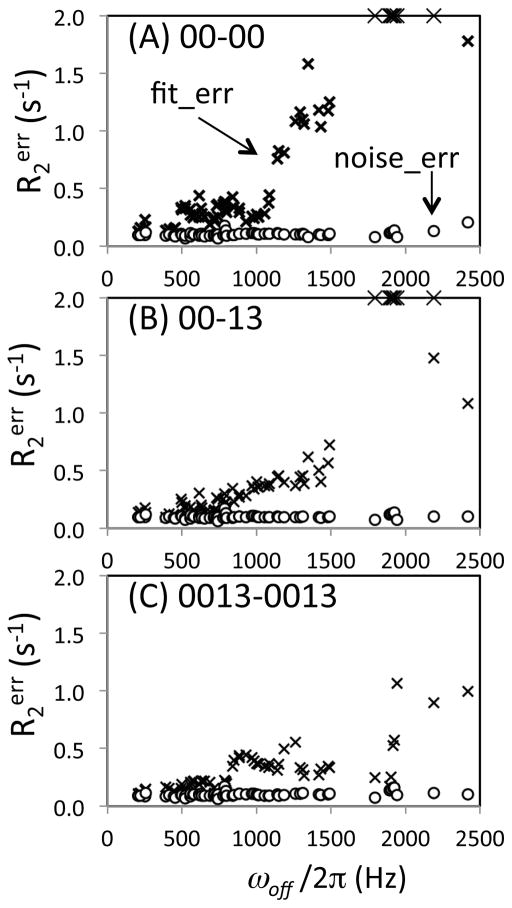
Figure 5.
Uncertainties, R2err, of the transverse relaxation rates for ubiquitin experimentally determined using (A) [00-00], (B) [00-13], and (C) [0013-0013] sequences on a 900 MHz NMR instrument, shown as a function of the off-resonance frequency, ωoff/2π. R2 values that are shown in Figure 4 are used. An additional 16 sets of data that exhibited R2err > 1 s−1 were also included in the graphs in order to show how the uncertainty increases as a function of ωoff/2π. R2err values were determined by two different Monte-Carlo error estimations in which the standard deviations of a Gaussian distribution function that generates synthetic data sets were given by rmsd of spectral noise, R2noise_err (circle), and by rmsd of residuals of the initial fit intensities, R2fit_err (×-symbols). Difference of the two uncertainties indicates errors other than experimental noise. R2err values above 2 s−1 are shown as the ceiling values.

