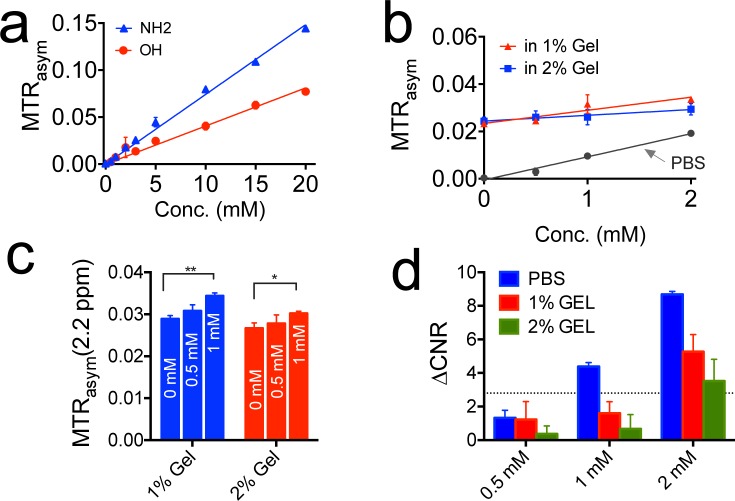
Figure 4. The detection limit of CEST MRI for detecting gemcitabine.
a. The calibration curves of the CEST signal of gemcitabine at concentrations ranging from 0.5 to 20 mM in PBS; b. The CEST MRI contrast at 2.2 ppm for samples prepared in 1% and 2% agarose gels, the CEST contrast in PBS is shown for comparison; c. Bar plots of the CEST contrast at different concentrations in each sample. A two-tailed paired Student's t-test was performed (**p < 0.01 and *P < 0.05). The results are mean ± SD (n = 3); d. Bar plots of the ΔCNR for samples containing gemcitabine at different concentrations as compared to reference samples containing 1% or 2% agarose gel. The horizontal dashed line represents ΔCNR = 2√2.

