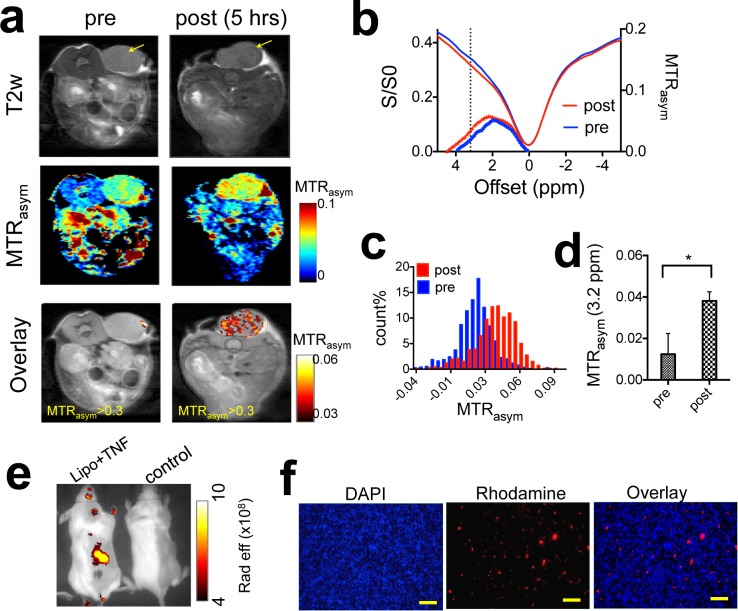
Figure 7. In vivo detection of the tumor uptake of liposomal gemcitabine using CEST theranostics.
a. CEST MRI detection of a CT26 tumor (co-treated with TNF-α) before and five hours after the i.v. injection of liposomal dFdC. From top to bottom: T2w images; CEST maps at ∼ 3.2 ppm; and CEST/T2w overlaid images (only the CEST in the tumor region is shown). b. Mean tumor CEST signal (MTRasym plots an Z spectra) before and after the injection. c. Histogram of the MTRasym values within the tumor regions, before and after the injection of liposomes. d. Statistical analysis of mean CEST signal changes in the tumor regions after the injection (n = 3). e. Whole body fluorescence imaging of a representative mice injected with liposomal dFdC (Gem-lipo) in the presence TNF-α, and a control mouse (saline injection). f. Histopathology of tumor section, clearly showing the accumulation and distribution of rhodamine-B-labeled liposomes in the tumor co-injected with liposomes and TNF-α. Nuclei are stained with DAPI (blue). (Scale bar = 100 μm).

