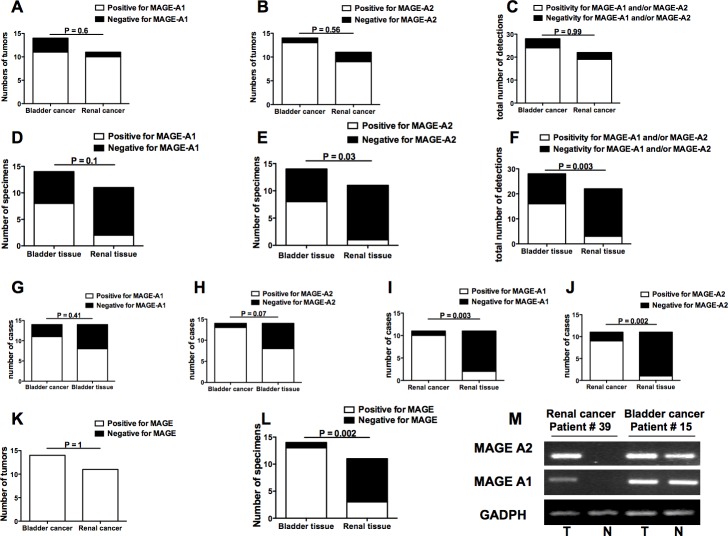
Figure 5. Frequencies of MAGE-A1 and MAGE-A2 gene expression in bladder and renal cancers as well as in bladder and renal apparently free-of-tumor tissues.
A. frequency of bladder or renal tumor showing or not MAGE-A1 gene expression; B. frequency of bladder or renal tumors showing or not MAGE-A2 gene expression; C. frequency of detections on bladder or renal tumors that resulted positive or not for any MAGE gene expression; D. frequency of bladder or renal apparently free-of-tumor tissue showing or not MAGE-A1 gene expression; E. frequency of bladder or renal apparently free-of-tumor tissue showing or not MAGE-A2 gene expression; F. frequency of detections on bladder or renal apparently free-of-tumor tissue that resulted positive or not for any MAGE gene expression; G. comparisons of frequencies of tissue samples showing MAGE-A1 gene expression between bladder cancers and autologous apparently free-of-tumor bladder tissues; H. comparisons of frequencies of tissue samples showing MAGE-A2 gene expression between bladder cancers and autologous apparently free-of-tumor bladder tissues; I. comparisons of frequencies of tissue samples showing MAGE-A1 gene expression between renal cancers and autologous apparently free-of-tumor renal tissues; J. comparisons of frequencies of tissue samples showing MAGE-A2 gene expression between renal cancers and autologous apparently free-of-tumor renal tissues; K. frequencies of bladder or renal tumors showing positivity or not for at least one of the two MAGE molecule gene expression; L: frequencies of apparently free-of-tumor bladder or renal tissues showing positivity or not for at least one of the two MAGE molecule gene expressions; M. Representative MAGE antigen gene expression analyses performed by RT-PCR on specimens from bladder cancer patient #15 and renal cancer patient #39. The figure shows the amplicons obtained after MAGE-A1, MAGE-A2, and GADPH (as positive control) cDNA amplification in tumors (T) and apparently free-of-tumor tissues (N) run on agarose gel. Panels A-L: Open bars indicate presence of MAGE antigen gene expression while black bars indicate absence of MAGE antigen gene expression.

