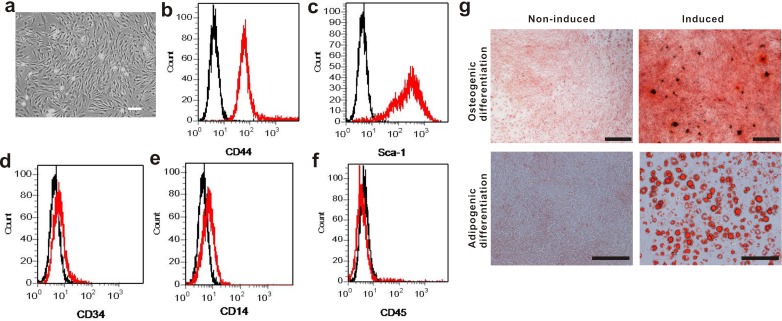
Figure 1. Phenotypic characterization of mouse BM-MSCs.
a. Cultured BM-MSCs after initial seeding for 5 days. Scale bar, 100 μm. b.-f. Flow cytometry analysis on BM-MSCs shows the majority of cells are CD44+, Sca-1+, CD34−, CD14− and CD45−, which are characteristic phenotypes of mouse BM-MSCs. g. BM-MSCs was capable of differentiating into osteogenic and adipogenic lineages. Cells were stained by Alizarin red staining for osteogenic differentiation and Oil red staining for adipogenic differentiation. Scale bar, 500 μm.

