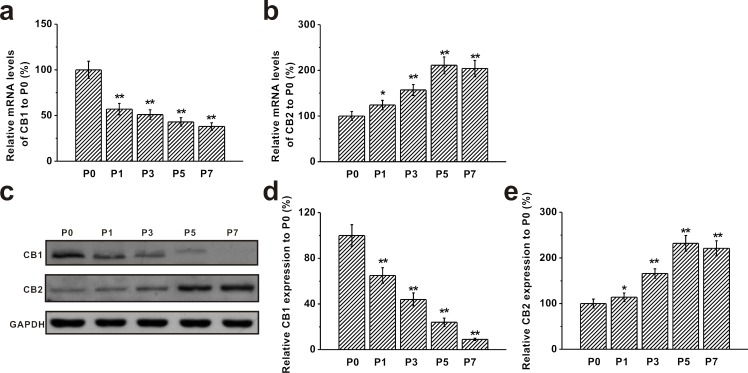
Figure 2. Expression of CB1 and CB2 receptors in mouse BM-MSCs.
a.-b. RT-PCR analysis of the mRNA levels of CB1 and CB2 receptors in MSCs from passage 0 (P0) to passage 7 (P7). Gene GAPDH was used as control. c. Western blot analysis of CB1 and CB2 protein expression in MSCs from P0 to P7. GAPDH was used as control. d.-e. Relative CB1 and CB2 protein expression in the cells normalized to those of P0. Data were presented as mean ± SEM. *p < 0.05 and **p < 0.01 versus P0 group.

