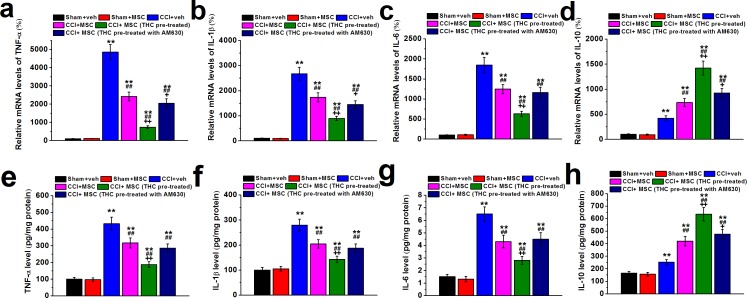
Figure 6. TNF-α (a and e), IL-1β (b and f), IL-6 (c and g) and IL-10 (d and h) mRNA expression and protein content in ipsilateral sciatic nerve of experimental mice 7 days after MSC administration.
The cytokine mRNA levels were determined by RT-PCR with GAPDH as a control and were normalized to those of sham+veh group. Cytokine protein contents were measured by ELISA and normalized to sample total protein. Data were presented as mean ± SEM. **p < 0.01 versus sham+veh group, ##p < 0.01 versus CCI+veh group, +p < 0.05 and ++p < 0.01 versus CCI+MSC group.

