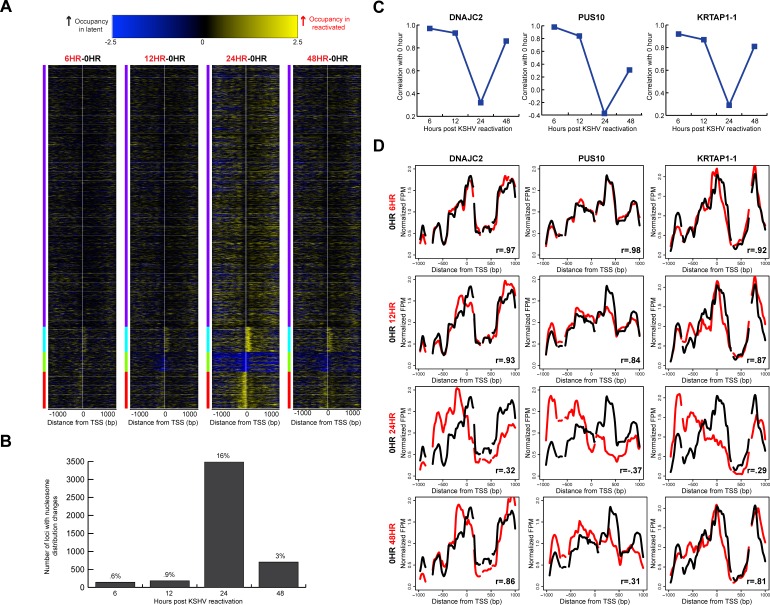
Figure 3. Widespread, transient translational nucleosome repositioning following KSHV reactivation.
A. Heat maps showing differences in nucleosome distributions between 0 hour (latent state) and 6, 12, 24, and 48 hours after KSHV reactivation, sorted on k-means cluster of four. The y-axis is genes of all human open reading frames. The x-axis is two-kb centered on the TSSs of all human open reading frames. The blue within the heat map indicates increased midpoints in the latent stat, and yellow within the heat map indicates increased midpoints in the reactivated time point. B. Using a correlation threshold (r = 0.7) between the latent state and reactivated states, TSSs with changes in nucleosome distributions were classified for 6, 12, 24, and 48 hours after KSHV reactivation. Approximately one in six TSSs had nucleosome redistributions at the 24 hour time point. C. Nucleosome distributions correlations between 0 hours and reactivated state time points for DNAJC2, PUS10, and KRTAP1-1. D. Nucleosome distributions of the latent (black line) and reactivated (red lines) KSHV time points for DNAJC2, PUS10, and KRTAP1-1. The x-axis represents genomic position, showing two-kb centered on a TSS. The y-axis is the normalized reads per million. The greatest nucleosome redistributions occur between the latent state and 24 hour time point.

