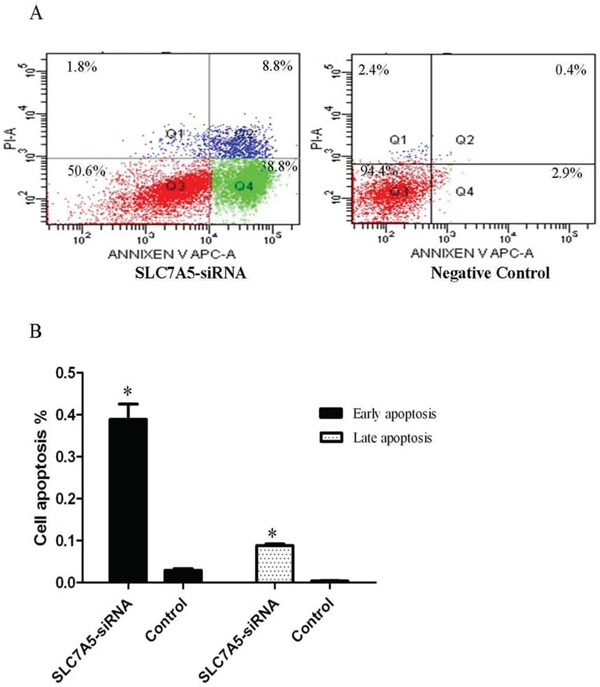
Figure 4. Down-regulation of SLC7A5 induces SKM-1 cells apoptosis.

Cell apoptosis analysis of SLC7A5-siRNA group and negative control group cells was analyzed by flow cytometry. A. Representative histograms of annexin V/PI double-staining flow cytometry. B. Percent apoptosis (including early and late apoptotic cells) determined by flow cytometry (n = 3). *P<0.05 vs control.
