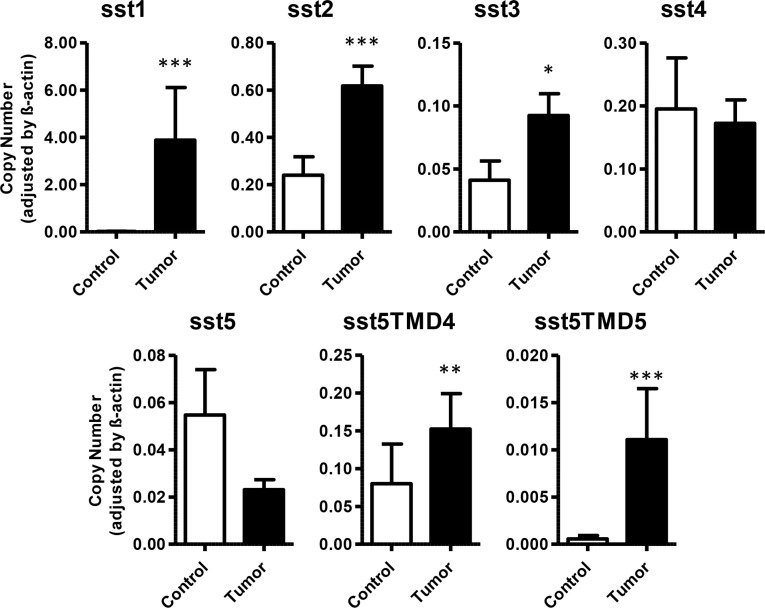
Figure 1. Expression of somatostatin receptors in GEP-NETs and adjacent non-tumor tissue.
Canonical (sst1–5) and truncated (sst5TMD4 and sst5TMD5) somatostatin receptors were measured by qPCR in a set of GEP-NETs, including primary and metastatic tissue. Values represent mean ± SEM of absolute mRNA values, adjusted by β-actin. Asterisks indicate significant differences between tumor and adjacent non-tumor tissues (p-values for t-test: *p < 0.05, **p < 0.01, ***p < 0.001).

