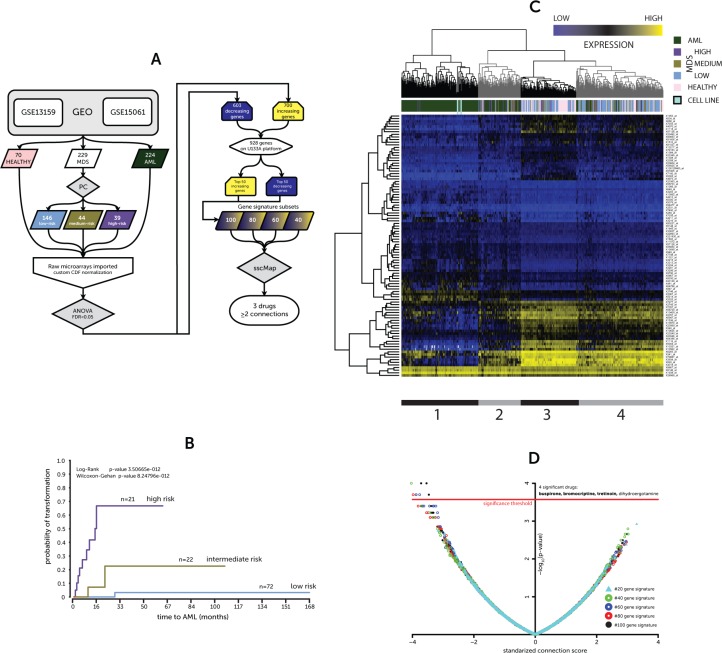
Figure 1.
(A) Overview of analytical approach (B) Kaplan-Meier for probability of AML transformation (C) Heatmap of expression for 50–50 gene signature (D) sscMap drug-signature connections. (A) Flowchart of analysis pipeline used to generate gene signature and identify compounds using sscMap (B) A Kaplan-Meier plot illustrating the stratification of a subset of MDS patient gene expression profiles between the prognostic classes and their risk of leukemic transformation (low, medium & high risk of transformation) (C) Hierarchical cluster of patient and donor gene expression profiles based on the identified 50–50 gene signature. Colored bars indicate patient or donor status. The model cell lines included in the screen are also represented in the heatmap and are connected to the heatmap to highlight their positioning. The expression values are presented as absolute microarray intensity values with yellow representing high expression and blue low expression. The grey and black bars underneath delineate the four clusters in the dendrogram, which are further discussed in the text. (D) A volcano plot of the connection scores and p-values generated by the sscMap tool between the gene expression signature and the broad institute perturbagen library. Each point represents a derived gene signature to perturbagen/cell line connection. The red line represents the threshold of statistical significance (∼3.573, p-value = ∼2.675 × 10⁻⁴) for the sscMap algorithm. There were 8 significant connections across all the signatures, all of which had a negative score and represented 4 drugs. The drugs with ≥ 2 connections are in bold.

