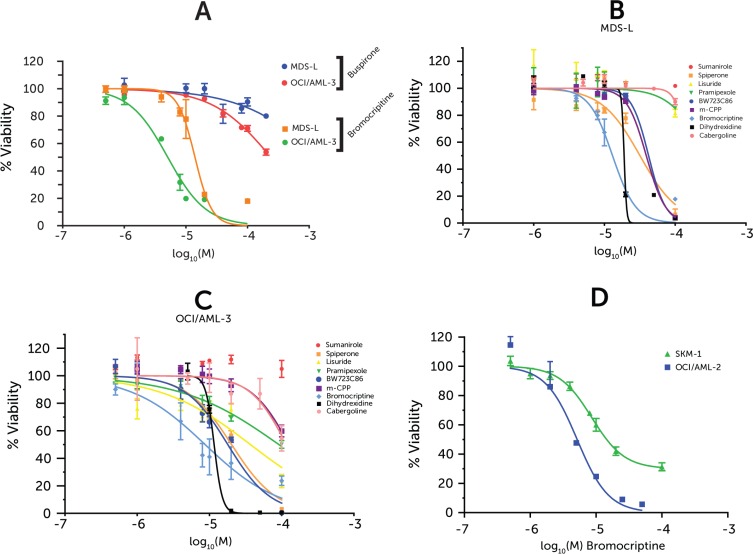
Figure 2. Drug dose-response in cell lines.
Cell viability measured via ATP-based high-throughput assay normalized to vehicle-treated control. Drug doses are represented as logarithm base 10 of Molarity. Points represent averages from 3 replicates and error bars represent SEM. (A) Bromocriptine & Buspirone screened against MDS-L and OCI/AML-3 (B) Neuroleptic compound screen against MDS-L (C) Neuroleptic compound screen against OCI/AML-3 (D) Bromocriptine-treated SKM-1 & OCI/AML-2 cell lines.

