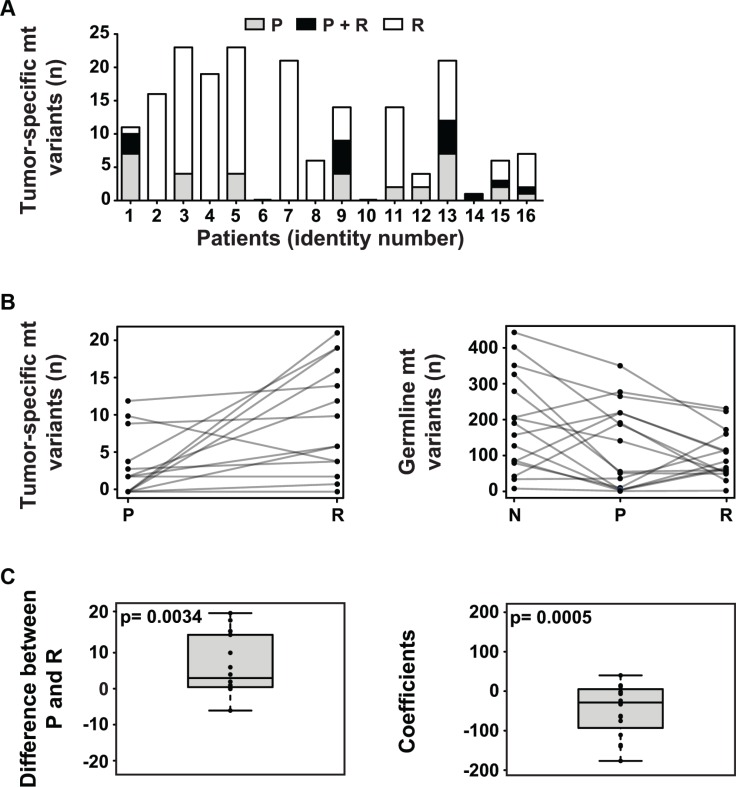
Figure 1. The mitochondrial genome in NB.
(A) The majority of NB harbors tumor-specific mt variants, with increased frequency at relapse. The number of tumor-specific mt variants per patient present in the primary tumor at diagnosis (P), relapsed tumor (R) or both (P + R) is shown. (B) The number of tumor-specific mt variants increases at relapse while the number of germline mt variants decreases during tumor initiation and relapse. In the left panel, the number of tumor-specific mt variants per patient in the primary (P) and the relapsed (R) tumor is shown. In the right panel, the number of germline mt variants per patient in normal tissue (N), primary tumor (P) and relapsed tumor (R) is depicted. (C) At relapse, the number of tumor-specific and germline mt variants significantly increases and decreases, respectively. In the left panel, the paired differences of tumor-specific variants between primary (P) and relapsed tumor (R) of each patient are plotted. The null hypothesis of the mean of the paired differences being equal to 0 was tested by Monte Carlo simulation and the exact p-value was calculated. For the right panel, a linear regression model was fitted for each patient. The slope coefficients of the fitted lines were used to depict the trend. The distribution of the coefficients is plotted. The null hypothesis, i.e. the mean of these coefficients being 0 when the number of variants in normal tissue, primary tumor and relapse are randomly distributed, was tested by Monte Carlo simulation and the exact p-value was calculated.

