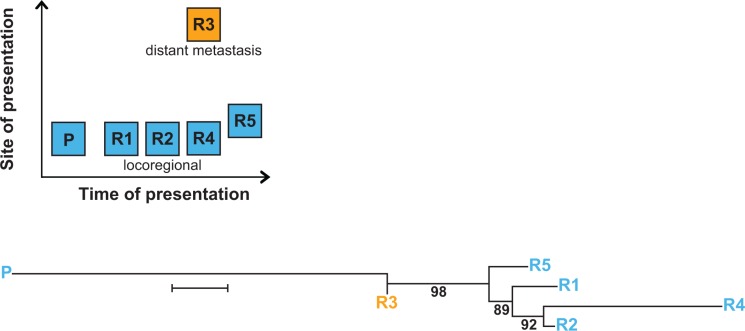
Figure 2. Multiple relapses in patient #12 reveal spatio-temporal change of tumor-specific mt variants.
The upper panel shows time and site of occurrence of the primary tumor and the relapses. The lower panel depicts the branching of relapse samples R1–R5 from the primary tumor P. Branch lengths reflect the phylogenetic distance between tumor samples (bar equals 0.2 base substitutions per site), numbers represent bootstrap values (%) supporting a given branching point. Phylogenetic reconstruction was performed using the Neighbor-Joining method for evolutionary history and the Jukes-Cantor method for evolutionary distances.

