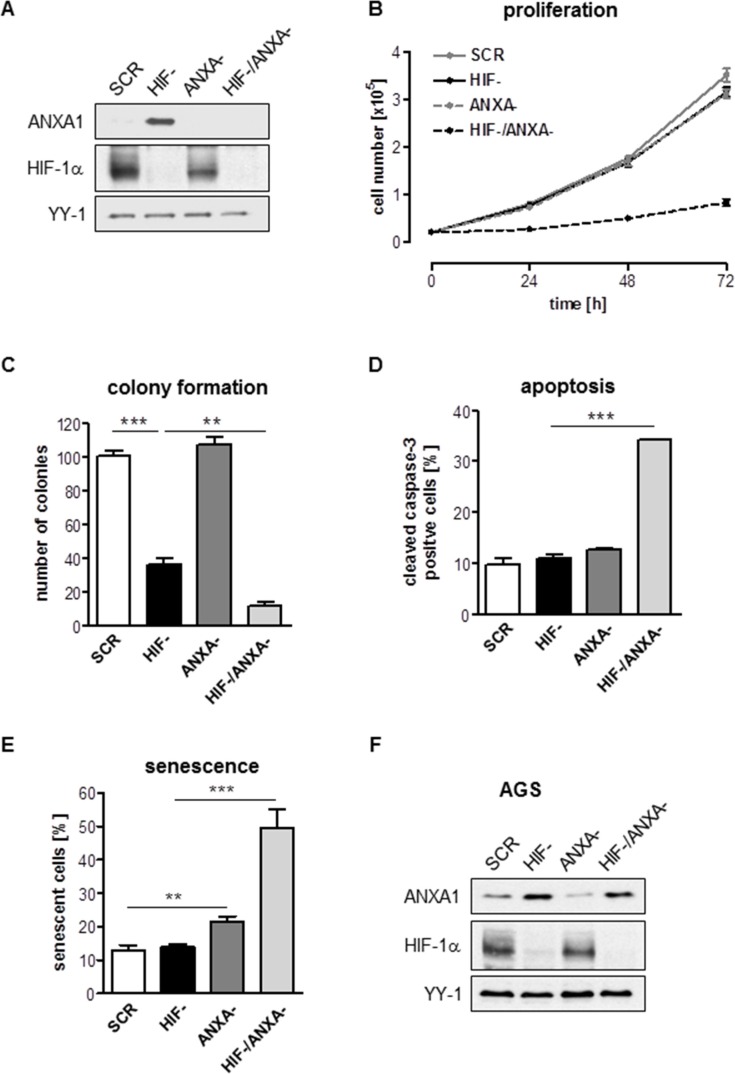
Figure 2. Effects of combined inhibition of HIF-1α and ANXA1 on AGS cell proliferation.
(A) Representative immunoblot analysis of ANXA1 and HIF-1α in control (SCR), HIF-1α-deficient (HIF-), ANXA1-deficient (ANXA-) and double knock-down (HIF-/ANXA-) cells. YY-1 served as loading control. (B, C) Anchorage-dependent (B) and anchorage-independent (C) proliferation. Results shown are representative of three independent experiments and values represent the mean ± SEM of triplicate determinations (**P < 0.01; ***P < 0.001). (D) Apoptosis was assayed by cleavage of caspase-3 followed by FACS analysis. Values are means ± SEM (***P < 0.001). (E) Senescence was quantified 96 h after cultivation by measurement of SA-β-Gal activity. Values are means ± SEM (**P < 0.01; ***P < 0.001). (F) Representative immunoblot analysis of ANXA1 and HIF-1α. Cells were passaged regularly and grown as monolayer cultures under recommended culture conditions for four weeks. YY-1 served as loading control.

