
Figure 4. PKs of ART-838 and AS in NSG mice.
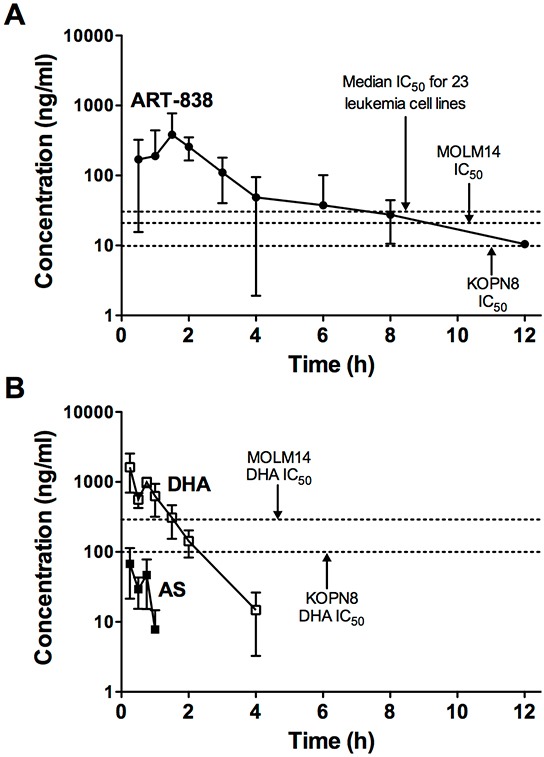
A. ART-838, B. AS, and DHA plasma concentrations in NSG mice treated with a single oral (gavage) dose of ART-838 (50 mg/kg) or AS (200 mg/kg). Plasma samples were obtained from 3-6 male NSG mice per time point (15min-24h after drug administration). Symbols represent concentrations of compound by LC/MS-MS detection. Dotted lines represent in vitro IC50s of DHA (Supplementary Table S3) or ART-838 (Supplementary Table S1) for MOLM14 and KOPN8 cells or the median ART-838 IC50 for all 23 tested leukemia cell lines (Supplementary Table S1). Detailed PK parameters are shown in Supplementary Table S4.