
Figure 5. Knock-down of CXCR2 results in inhibited growth of E6-E7-st-KRAS cells in the subcutaneous implants.
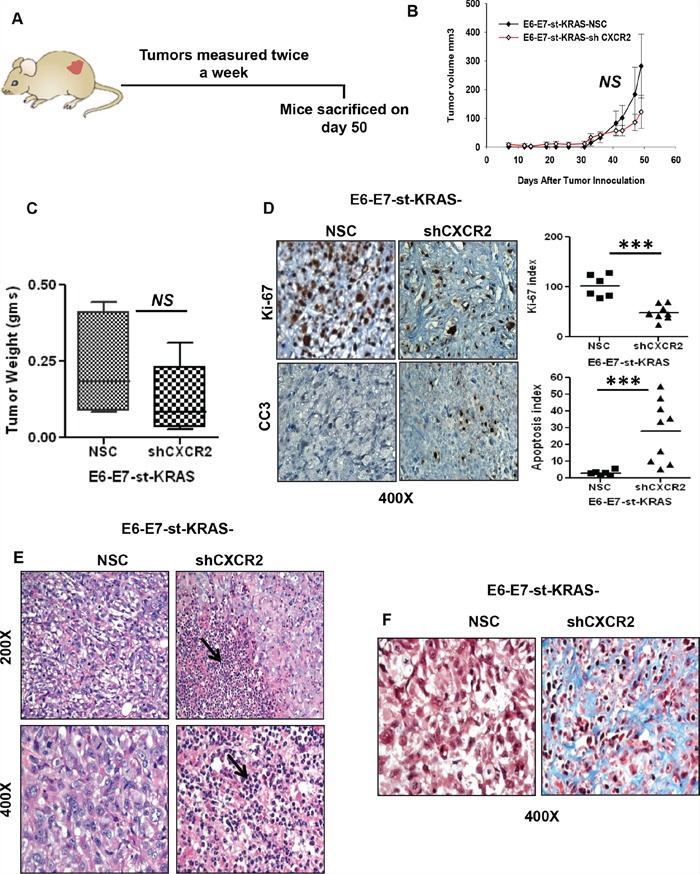
A. E6-E7-st-KRAS-NSC and E6-E7-st-KRAS-shCXCR2 cells were engrafted subcutaneously in the flanks of nude mice and tumors were measured twice weekly. B. Tumor growth represented by the change in tumor volume (mm3) of subcutaneous tumors at indicated time points after inoculation. C. The mean weight of tumors derived from mice bearing either E6-E7-st-KRAS-NSC or E6-E7-st-KRAS-shCXCR2 cells. D. Representative images of immunohistochemical (IHC) staining for Ki-67 and cleaved caspase3 (CC3) in tumors of mice bearing E6-E7-st-KRAS-NSC or E6-E7-st-KRAS-shCXCR2 cells. IHCs were quantified as the average of positive cells in five independent fields per tumor at 400X. E. H&E staining showing infiltration of leukocytes in tumors derived from mice bearing either E6-E7-st-KRAS-NSC or E6-E7-st-KRAS-shCXCR2 cells. F. Masson's trichrome stain demonstrating collagen deposition. Statistical significance determined by paired Student's t-test (for tumor volume) and non-parametric Mann-Whitney U test. (*p ≤ 0.05, **p ≤ 0.01, ***p ≤ 0.001, NS p > 0.05).