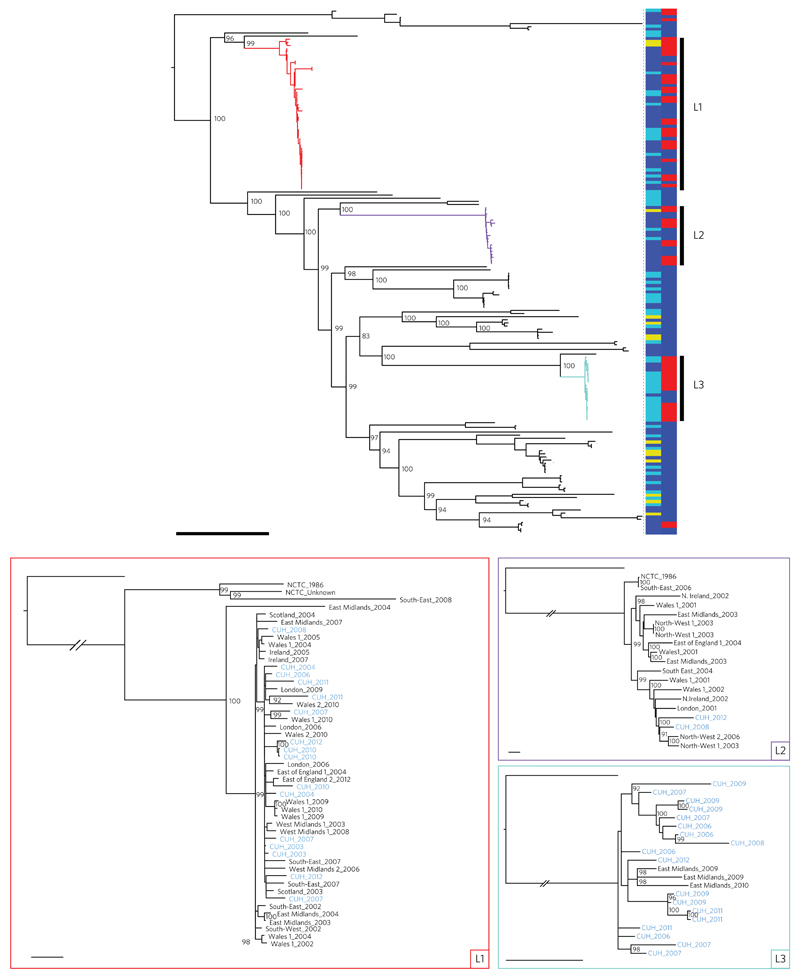
Figure 1. Phylogeny of E. faecalis isolates drawn from across the UK and Ireland.
Top: midpoint rooted maximum likelihood tree of 168 E. faecalis isolates based on SNPs in the core genome. Coloured branches indicate the three dominant lineages (L1, red; L2, purple; L3, turquoise). Vertical bars show the source of each isolate on the left (dark blue, BSAC; light blue, CUH; yellow, NCTC) and the presence (red) or absence (blue) of vancomycin resistance determinants on the right. Bootstrap supports over 90% are labelled for the major nodes. Scale bar, 10,000 SNPs. Bottom: maximum likelihood trees of the three dominant lineages (L1, red; L2, purple; L3, turquoise) based on SNPs in the core genome after recombination was removed, and rooted on an outlier. The trees are labelled by referral network, with ‘1’ and ‘2’ indicating different hospitals within the referral network if more than one contributed to the BSAC study collection, and year of isolation with CUH isolates highlighted in blue. Bootstrap supports over 90% are labelled. Scale bars, 25 SNPs.

