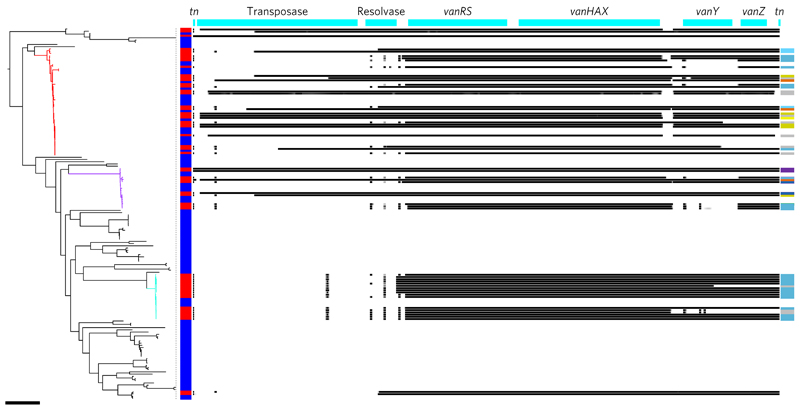
Figure 4. Mapping variation in the vancomycin resistance transposon.
Midpoint rooted maximum likelihood tree of all 168 E. faecalis with the three dominant lineages highlighted (L1, red; L2, purple; L3, turquoise) and the presence (red) or absence (blue) of a van transposon indicated in the vertical bar. Right: coverage plot (number of sequence reads that map to that location) of the vanA transposon in each isolate, with black indicating presence (30× coverage or above), graduating to white indicating absence (less than 10× coverage). The genes are labelled in the top bar (tn = inverted repeat). Colours in the vertical bar on the right indicate the different insertion sites in the three dominant lineages, with a description of each colour provided in Supplementary Table 4. Scale bar, 10,000 SNPs.

