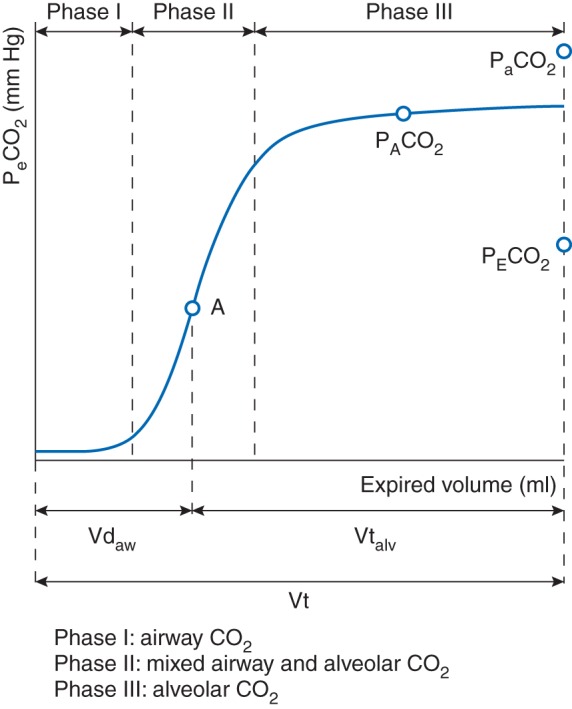
Fig 1.

Schematic model of three phases of the expiration. The Vcap curve is divided in three phases. Phase I represents exhaled CO2 from the airways, whereas phase III represents exhaled CO2 from the alveoli. Phase II is a mixed phase with CO2 from both the airways and alveoli. Point A is the inflection point of phase II, which is the theoretical point where the airway compartment is separated from the alveolar compartment. VDaw, airway dead space, Vtalv, alveolar tidal volume, Vt, tidal volume.
