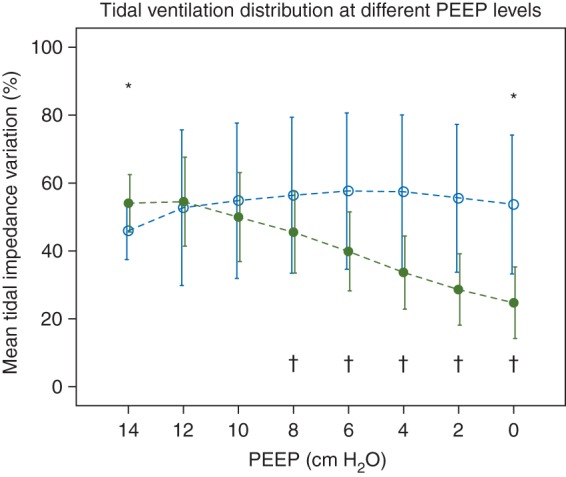
Fig 2.

Tidal Impedance Variation at different PEEP levels. Data are shown as mean (sd). In the dependent lung region the ventilation distribution was decreased when PEEP was lowered, whereas the non-dependent region received more ventilation as compared with PEEP 14 cm H2O. * Indicates a significant reduction in TIV of the non-dependent region according to 6 cm H2O. † Indicates a significant reduction in TIV of the dependent region as compared with 12 cm H2O. Dashed lines represents the interpolation lines; open circles=non-dependent region; solid circles=dependent region. P<0.05 was considered significant.
