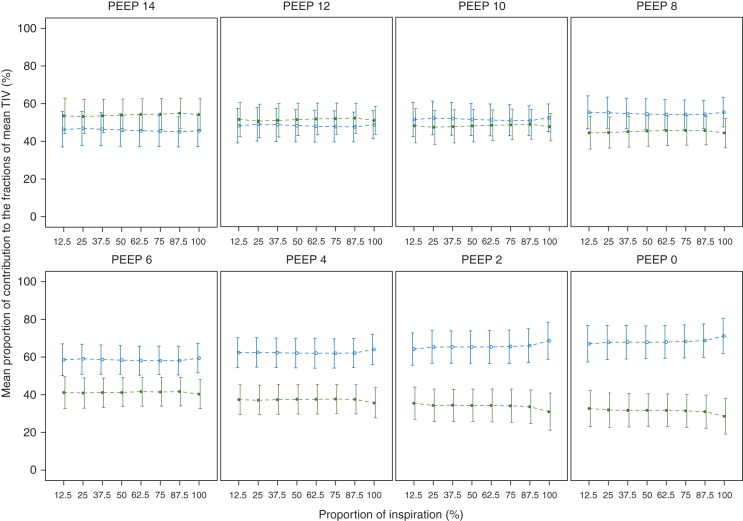
Fig 3.
Mean intratidal gas distribution (ITV) curve of all the patients at each PEEP step. Data are shown as mean (sd). ITV curve represents the mean percentile contribution (%) of ventilation distribution in non-dependent and dependent lung regions during the entire inspiration. At PEEP 12 and 10 cm H2O, intratidal gas distribution curves stayed close to each other, showing equal distribution to both regions. Dashed lines represents the interpolation lines; open circles=non-dependent region; solid circles=dependent region.

