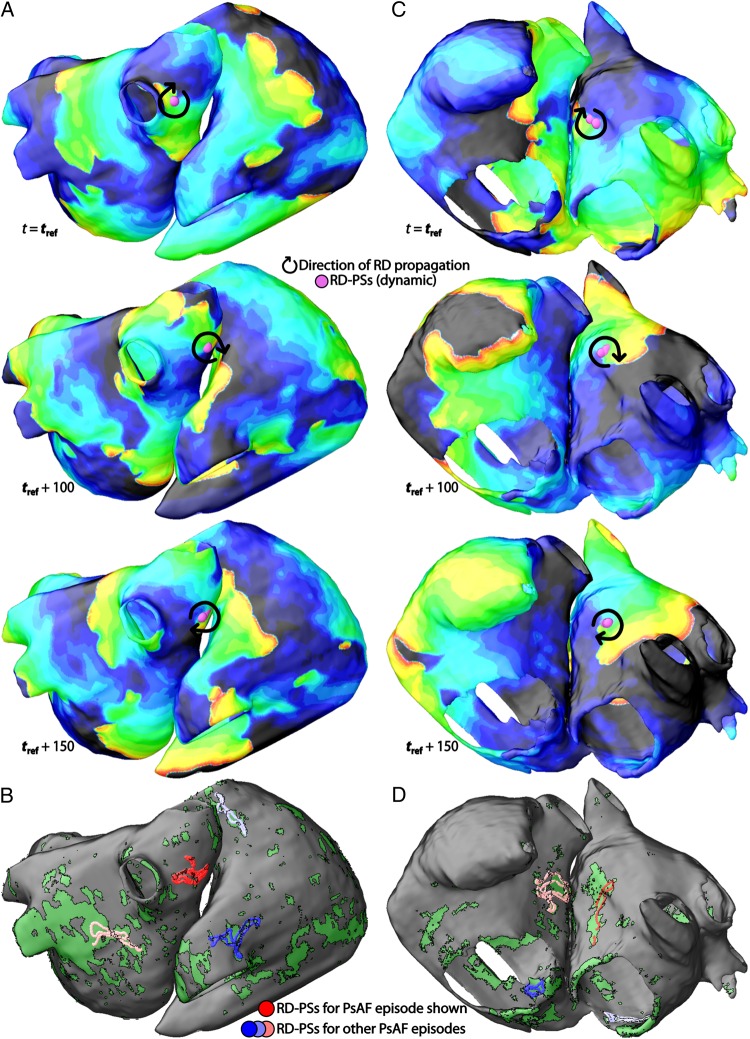
Figure 3.
Locations of RD-PSs. (A) Sequence of Vm maps during AF for atrial model no. 1. The locations of RD-PSs and direction of RD propagation are indicated with purple circles and black arrows, respectively. (B) The aggregate locations of RD-PSs for all AF episodes observed in patient model no. 1 (distinct colours reflect distinct AF morphologies). Red circles correspond to RD-PSs in the AF episode in (A). (C) Sequence of Vm maps during AF for patient model no. 16. (D) The aggregate locations of RD-PSs for all AF episodes in patient model no. 16. Red circles correspond to the RD-PSs in the AF episode in (C).

