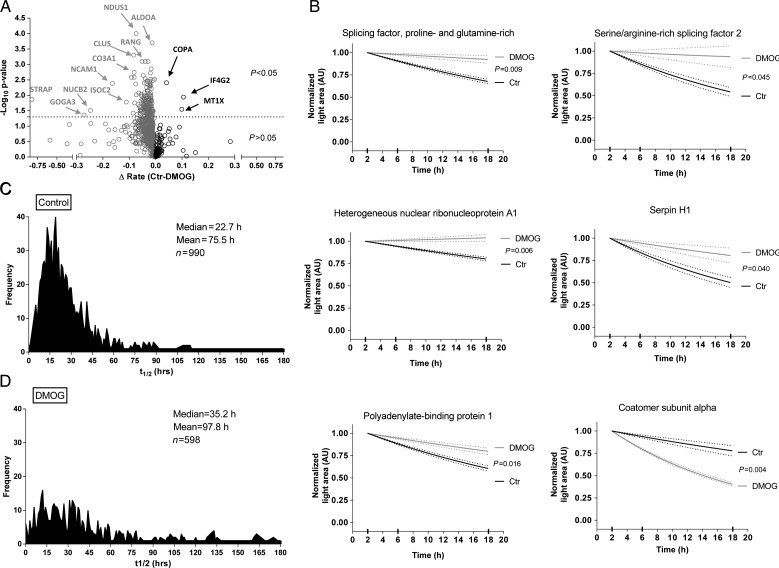
Figure 2.
Quantitative assessment of light proteins. (A) Volcano plot analysis shows the distribution of light proteins between control and DMOG. First-order kinetic slopes were calculated from three time points. Two-way ANOVA was used for calculating the P-values from the fit of first-order equations. Interesting targets are labelled and highlighted by arrows. Proteins stabilized by DMOG are on the left side and those destabilized are on the right of the origin. Y-axis shows the negative log10 P-value and the X-axis shows the differences in rate (control − DMOG). (B) Representative fits for selected proteins. The dotted lines show the measure of error. Distribution of protein half-lives under control (C) or DMOG (D) obtained by the first-order equations to multi-point data (2, 6, and 18 h). Light peptide areas are shown normalized to the 2 h time point for both groups.

