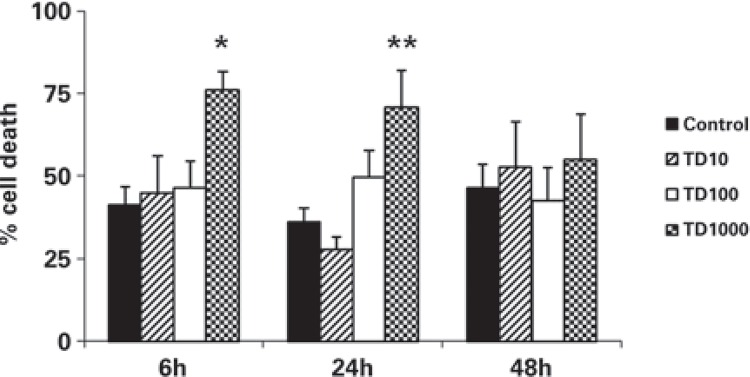
Figure 2. Dead cells after incubation for 6, 24 and 48 hours, at doses of 10, 100 and 1,000µg/mL Turnera diffusa extract.
The data represent the mean ± SEM of four independent experiments done in triplicate. Analysis of Variance/Duncan: *p<0.05 (compared to all other groups, at 6 hours); **p<0.05 (compared to the control group and the group TD10, at 24 hours).

