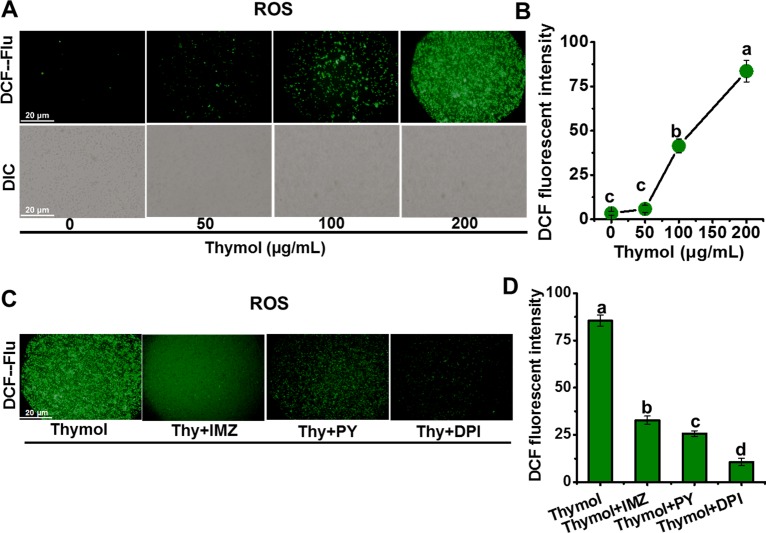
Fig 2. Thymol induced the generation of ROS in spores of A. flavus.
(A, B) The image and relative intensity of DCF fluorescence were obtained when the spores were exposed to thymol (0, 50, 100, 150, and 200 μg/mL, respectively) for 30 min; (C, D) The image and relative intensity of DCF fluorescence were obtained when the spores treated with NADPH oxidase inhibitors (DPI, PY, and IMZ) were exposed to 200μg/mL thymol for 30 min. Each data point or bar was indicated as the means of 3 replicates ± standard deviation. Asterisk indicates that mean values of three replicates are significantly different from the treatment of thymol (P<0.05). Different letter indicate a significant difference between them (P <0.05).

