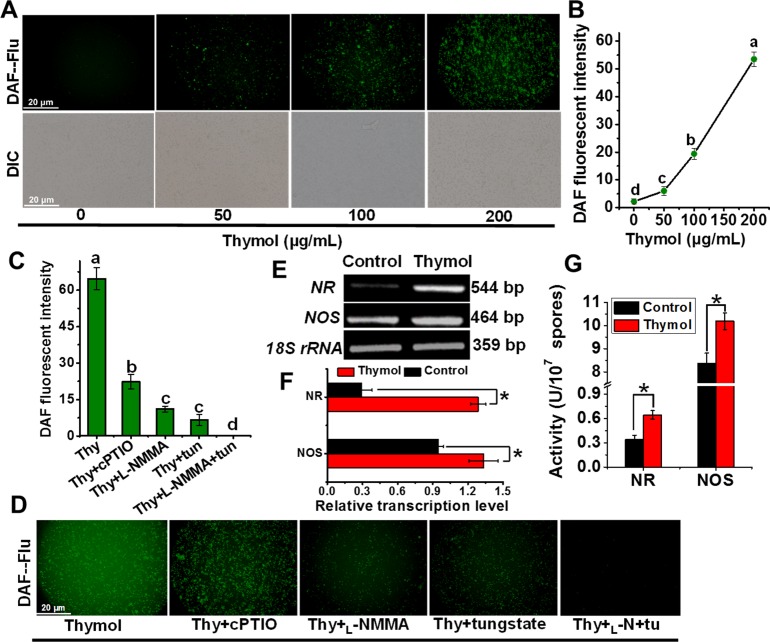
Fig 3. Thymol induced the generation of NO via NR and NOS in spores of A. flavus.
(A, B) The image and relative intensity of DAF fluorescence were obtained when the spores were exposed to thymol (0, 50, 100, 150, and 200 μg/mL, respectively) for 150 min; (C, D) The image and relative intensity of DAF fluorescence were obtained when the spores were exposed to 200μg/mL thymol for 150 min after the treatment with NOS inhibitors (L-NMMA), NR inhibitor (tungstate) and NO scavenger (cPTIO), respectively; (E, F) The RT-PCR products in the agarose gel and the relative transcription levels of NR and NOS gene normalized on 18S rRNA level in the spores post the exposure of thymol for 3h; (G) The NR and NOS activities in the spores post the exposure of thymol for 3h. Each data point or bar was indicated as the means of 3 replicates ± standard deviation. Asterisk indicates that mean values of three replicates are significantly different from the treatment of thymol (P<0.05). Different letter indicate a significant difference between them (P <0.05).

