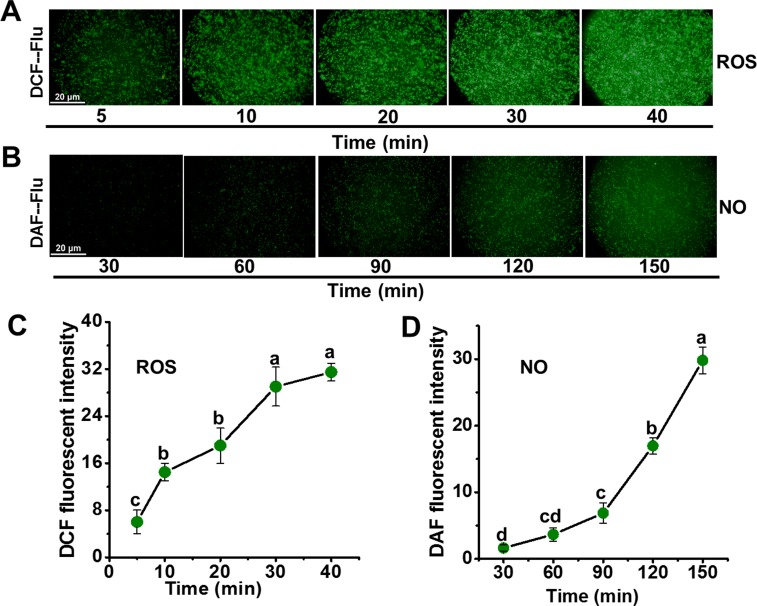
Fig 4. Time course of ROS (A, C) and NO (B, D) generation in spores exposed to thymol.
(A) Image of DCF fluorescence was obtained when spores were exposed to 200μg/mL thymol for 0, 10, 20, 30 and 40 min; (B) Image of DAF fluorescence was obtained when spores were exposed to 200μg/mL thymol for 30, 60, 90, 120 and 150 min; (C) Relative intensity of DCF fluorescence; (D) Relative intensity of DAF fluorescence. Each data point was indicated as the means of 3 replicates ± standard deviation.

