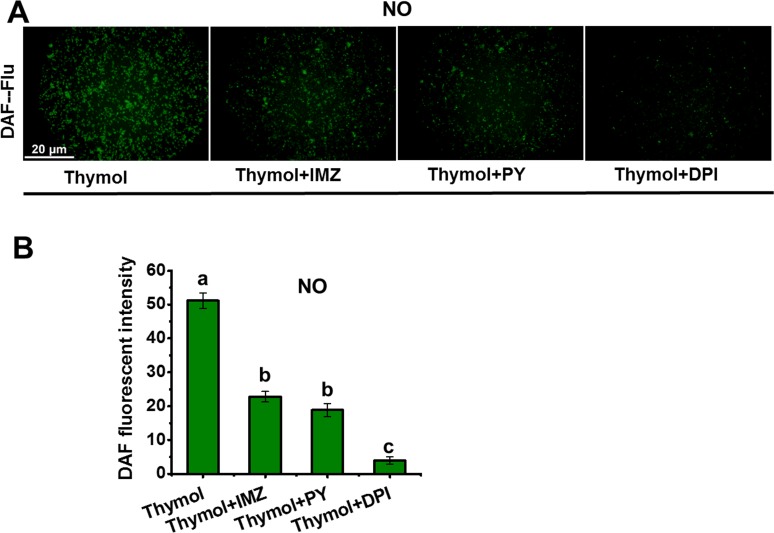
Fig 5. NO generation by blocking the ROS generation in the spores exposed to thymol.
(A) The image of DAF fluorescence was obtained when the spores treated with NADPH oxidase inhibitors (DPI, PY, and IMZ) were exposed to 200μg/mL thymol for 150min; (B) Relative intensity of DAF fluorescence. Each data bar was indicated as the means of 3 replicates ± standard deviation. Asterisk indicates that mean values of three replicates are significantly different from the treatment of thymol (P<0.05).

