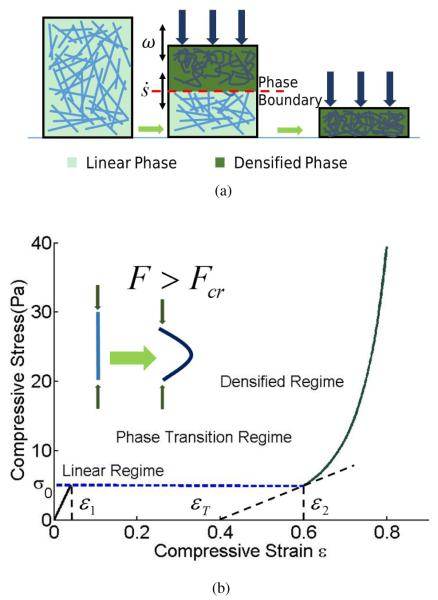
Fig. 1.
A fiber network under compression. (a) The top panel is a cartoon, schematically showing the high strain phase with a densified network on the right, the low strain phase with straight fibers on the left and a mixture of these two phases in the middle. Here ω indicates the frequency of applied oscillation and is the rate of change of phase fraction due to this oscillation. In the middle figure a sharp phase boundary separates the linear phase in the bottom from the densified phase on the top. The fraction of densified phase increases with increasing compressive strain. (b) The bottom panel quantitatively shows the tri-phasic stress-strain response of such a material assuming quasi-static loading. Theoretical curves are plotted according to Eqns. (3) and (8). We have used l = 1.32μm, d = 0.22μm, ν = 0.1μm−3, and the two coefficients n = 3, k = 0.5 corresponding to a fibrin network.

