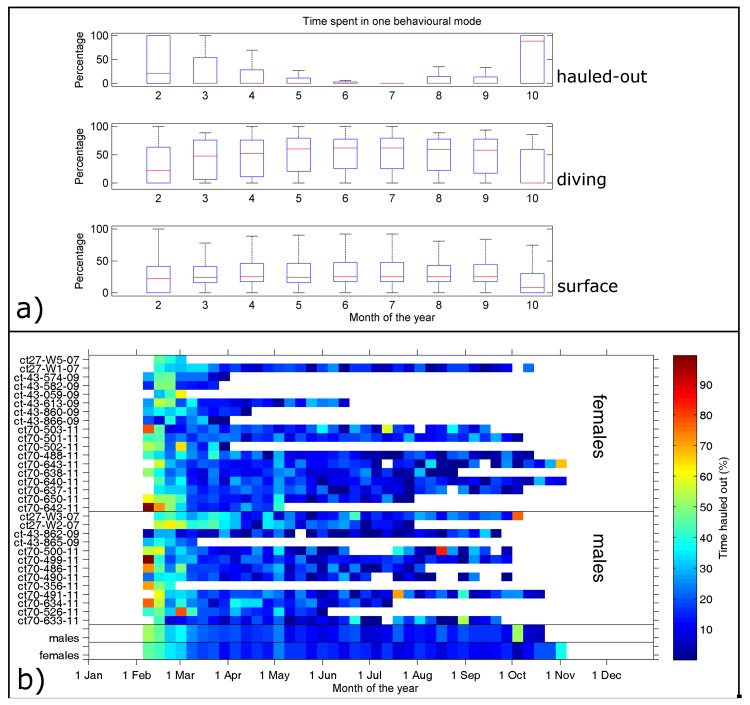
Fig 2. Time series of time spent in different behavioural modes.
(A) Time series of monthly percentage time spent in different behavioural modes for all seals. (B) Weekly average of percentage time spent hauled out for each seal used in this study. The two bottom lines show the weekly mean values for males and females respectively.

