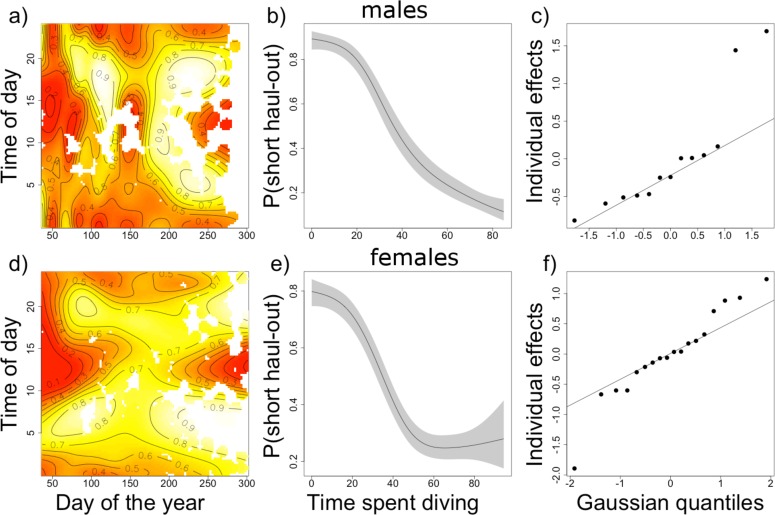
Fig 6. Marginal relationship between model covariates and the probability of a short haul-out.
The first column shows the estimated relationship for the tensor product between time of day and day of the year. Areas of low probability of short haul-outs appear red and areas of high probability of short haul-outs appear yellow. The black contour lines give the estimated probability of short haul-out events across the two-dimension space shown. The second column shows the smooth relationship between time spent diving prior to a haul-out event and the probability of a short-duration haul-out. The third column shows the random effect for individual. The relationships are shown for males (top row, figures a to c) and females (bottom row, figures d to f).

