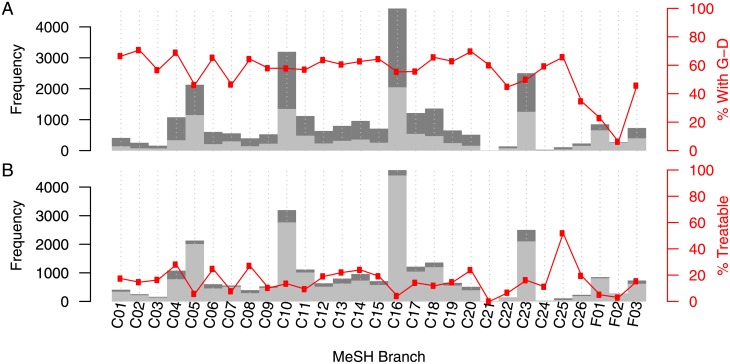
Fig 4. Identifying a therapeutic area of interest.
(A) Dark grey shows the number of diseases in each therapeutic area of the MeSH hierarchy. Light grey shows the number of those diseases that are not involved in any of the gene-disease associations captured in our network. Red shows the number of diseases that are involved in a gene-disease association as a percentage of the total number of diseases in that therapeutic area. (B) Dark grey shows the number of diseases in each therapeutic area of the MeSH hierarchy. Light grey shows the number of those diseases that currently do not have a small molecule treatment on the market. Red shows the number of diseases that do have a treatment on the market as a percentage of the total number of diseases in that therapeutic area. Note: please see S1 Table for disease area names.

