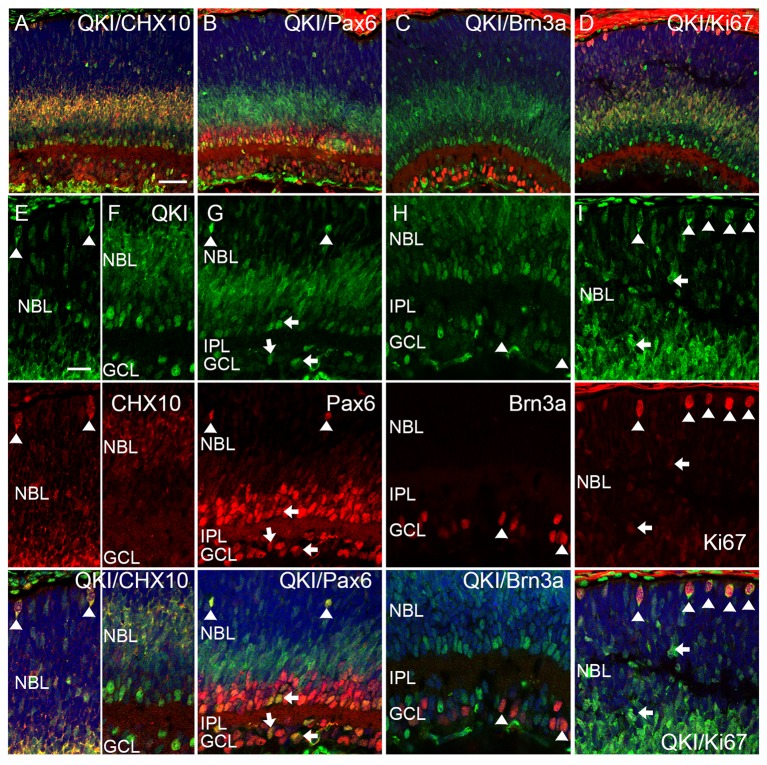
Fig 4. Characterization of QKI-expressing cells in the P5 retina.
(A-I) Retinal sections at P5 were double stained with anti-QKI antibody (green) and antibodies specific for other retinal markers (red). Nuclei were counterstained with TO-PRO-3 (blue). (A, E, F) QKI signals at the apical edge (E, arrowheads) and inner part (F) of the NBL merge with Chx10. (B, G) QKI-positive cells in the outer NBL and in the peripheral IPL express Pax6 signals (arrowheads and arrows, respectively). (C, H) Some weak QKI signals in the GCL merge with Brn3a signals (arrowheads). (D, I) QKI signals are detected in strongly and weakly Ki67-positive cells (D, I, arrowheads and arrows). Scale bars are 50 μm for A-D and 20 μm for E-I.

